SPSS Tool Project Report - Doc
Added on 2020-01-23
20 Pages3520 Words40 Views
SPSS PROJECT
TABLE OF CONTENTS
Introduction......................................................................................................................................1
Validate the data set, use descriptive statistics, charts or tables to describe and summarise the
key characteristics of the variables..............................................................................................1
Graphical Presentation.................................................................................................................3
Critically apply chi-squared tests.................................................................................................7
Regression Analysis...................................................................................................................16
T-Test Model.............................................................................................................................17
Recommendations for the LTT or Tanzania Government.........................................................18
Conclusion.....................................................................................................................................19
References......................................................................................................................................20
INTRODUCTION
The Livingstone Tanzania Trust is a grassroots self-help development charity that
facilitates social, economic and environmental change within the Manyara Region of Northern
Tanzania. This is achieved by addressing education and enterprise issues that hinder the
community from achieving their development potential. In this regard, Household survey was
conducted by the Livingstone Tanzania Trust. However, the main purpose of this survey was to
understand and identify the areas in which Managhat community is facing major issues and
problems. The majority of the survey was conducted face to face with the head of the household
or their representative while the remaining aspects of the survey were gained through visual
inspections of the property. Furthermore, in order to analyse the collected SPSS tool has been
used in which descriptive analysis and Chi Square test has been employed to analyse the
collected data so that appropriate and suitable recommendations can be made to the Government
of Tanzania.
Validate the data set, use descriptive statistics, charts or tables to describe and summarise the key
characteristics of the variables
Primary data Descriptive analysis:
Level
of
educa
tion
attain
ed by
Head
BoysEducP
rimary
BoysEducSe
condary
GirlsEdu
cPrimary
How
many
mosquit
o nets at
home?
GirlsEducSe
condary
N Valid 295 117 39 82 289 30
Missi
ng
2 180 258 215 8 267
Mean 1.57 1.21 .87 1.11 1.37 .63
Median 2.00 1.00 1.00 1.00 1.00 .00
Mode 2 1 0 1 2 0
1

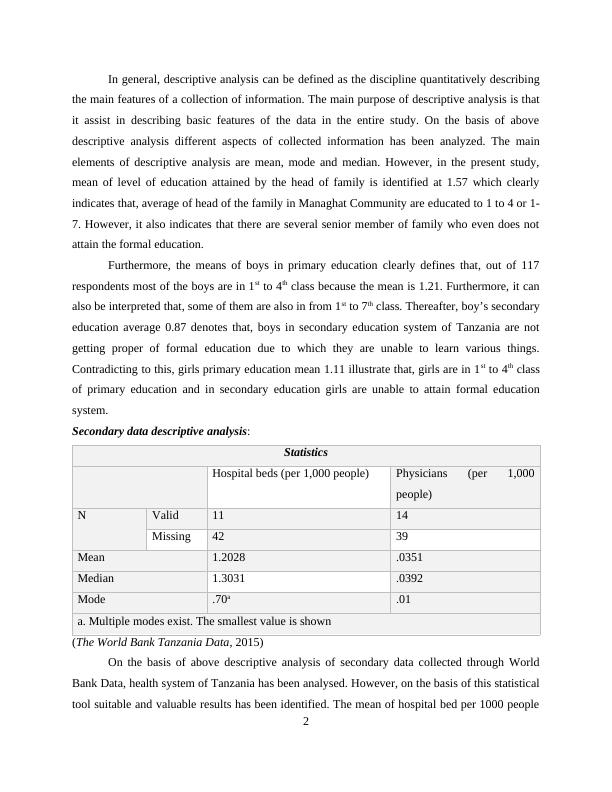
In general, descriptive analysis can be defined as the discipline quantitatively describing
the main features of a collection of information. The main purpose of descriptive analysis is that
it assist in describing basic features of the data in the entire study. On the basis of above
descriptive analysis different aspects of collected information has been analyzed. The main
elements of descriptive analysis are mean, mode and median. However, in the present study,
mean of level of education attained by the head of family is identified at 1.57 which clearly
indicates that, average of head of the family in Managhat Community are educated to 1 to 4 or 1-
7. However, it also indicates that there are several senior member of family who even does not
attain the formal education.
Furthermore, the means of boys in primary education clearly defines that, out of 117
respondents most of the boys are in 1st to 4th class because the mean is 1.21. Furthermore, it can
also be interpreted that, some of them are also in from 1st to 7th class. Thereafter, boy’s secondary
education average 0.87 denotes that, boys in secondary education system of Tanzania are not
getting proper of formal education due to which they are unable to learn various things.
Contradicting to this, girls primary education mean 1.11 illustrate that, girls are in 1st to 4th class
of primary education and in secondary education girls are unable to attain formal education
system.
Secondary data descriptive analysis:
Statistics
Hospital beds (per 1,000 people) Physicians (per 1,000
people)
N Valid 11 14
Missing 42 39
Mean 1.2028 .0351
Median 1.3031 .0392
Mode .70a .01
a. Multiple modes exist. The smallest value is shown
(The World Bank Tanzania Data, 2015)
On the basis of above descriptive analysis of secondary data collected through World
Bank Data, health system of Tanzania has been analysed. However, on the basis of this statistical
tool suitable and valuable results has been identified. The mean of hospital bed per 1000 people
2
End of preview
Want to access all the pages? Upload your documents or become a member.
Related Documents
Univariate Analysis II Regressionlg...
|28
|5189
|25
Companion Encyclopedia of Psychologylg...
|4
|517
|16
Research in East London: SPSSlg...
|24
|2294
|277
Integrating Quantitative and Qualitative Approacheslg...
|26
|3747
|19
Evaluation of Questionnaire Designlg...
|34
|5482
|72
Data Collection and Analysis for Research Projectlg...
|15
|3138
|304