Calculation of Mean Mode and Median : Statistics Assignment
Added on 2020-07-23
35 Pages5684 Words57 Views
INTRODUCTION TO RESEARCH:STATISTICS ASSIGNMENT
Table of ContentsINTRODUCTION...........................................................................................................................3SECTION B.....................................................................................................................................31. Strength and Weakness of fact that is used to select people included in dataset....................32. Calculation of mean, median and mode..................................................................................43. Calculation of cross tabulation, correlation..........................................................................28CONCLUSION..............................................................................................................................29REFERENCES..............................................................................................................................30
INTRODUCTIONSPSS statistics is the software which assist in handling large set of statistical data. Presentstudy will discuss strengths and weaknesses of facts that are used for selecting people that areincluded in dataset. Calculation of mean, mode, median in respect to various variables will bedone in this assignment. Correlation, cross tabulation will be calculated in this report. SECTION B1. Strength and Weakness of fact that is used to select people included in datasetProbability sampling is considered as one of the most effective way of selecting samplesfor particular study (Brar, Malik and Kaur, 2017). In this technique, each item has equal chanceof getting selected. It is the tool which is used in both qualitative and quantitative type ofinvestigations. This process is free from biasness thus, scholar can gather relevant and reliableinformation by using probability sampling technique. In the Sports Data, scholar has usedprobability sampling tool for this project(Fox, Levin and Forde, 2013). Strengths of this methodare as following:Cost effective: Probability sampling such as random sampling is the method in whichscholar can select participants on random basis from mass population. This saves timeand cost in choosing people randomly. Researcher can take any number of samples withthe help of probability sampling tool (Coumans and et.al, 2014).Involves lesser degree of judgement: In this process scholar assign task on random basisthus, individual can get accurate data which is far from biasness. Easy way of sampling: It is quite simple and short process as compare to non-probabilitysampling technique. For example, if person wants to collect information about number ofmale persons those who have played any sport during last four weeks (Davis, 2015), thenone can easily gather information by using probability sampling technique. Because whenrespondents are selected on random basis so there will be no confusion and individual canget data easily. Weaknesses:Shortcomings of probability sampling are discussed as below:Chances of selecting samples which are from specific class: In probability samplingresearcher has to choose samples randomly thus individual can select specific class3
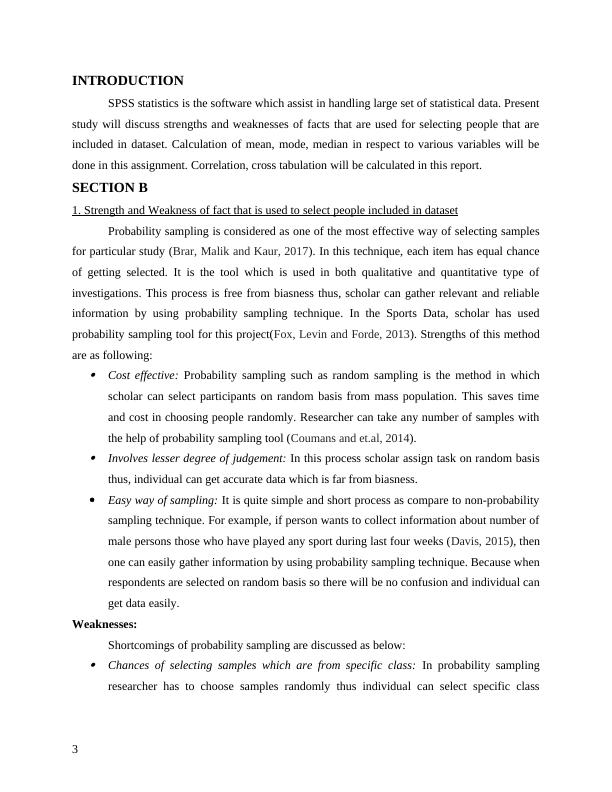
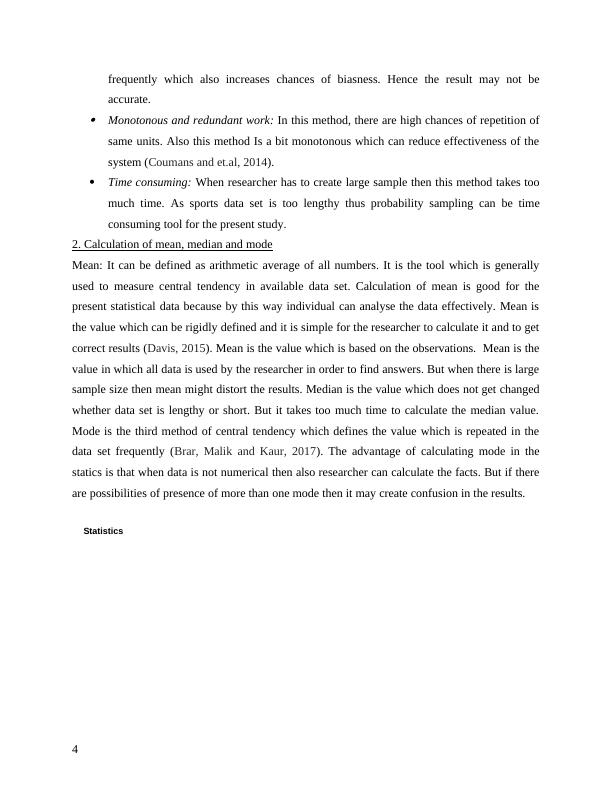
frequently which also increases chances of biasness. Hence the result may not beaccurate. Monotonous and redundant work: In this method, there are high chances of repetition ofsame units. Also this method Is a bit monotonous which can reduce effectiveness of thesystem (Coumans and et.al, 2014).Time consuming: When researcher has to create large sample then this method takes toomuch time. As sports data set is too lengthy thus probability sampling can be timeconsuming tool for the present study. 2. Calculation of mean, median and modeMean: It can be defined as arithmetic average of all numbers. It is the tool which is generallyused to measure central tendency in available data set. Calculation of mean is good for thepresent statistical data because by this way individual can analyse the data effectively. Mean isthe value which can be rigidly defined and it is simple for the researcher to calculate it and to getcorrect results (Davis, 2015). Mean is the value which is based on the observations. Mean is thevalue in which all data is used by the researcher in order to find answers. But when there is largesample size then mean might distort the results. Median is the value which does not get changedwhether data set is lengthy or short. But it takes too much time to calculate the median value.Mode is the third method of central tendency which defines the value which is repeated in thedata set frequently (Brar, Malik and Kaur, 2017). The advantage of calculating mode in thestatics is that when data is not numerical then also researcher can calculate the facts. But if thereare possibilities of presence of more than one mode then it may create confusion in the results. Statistics4
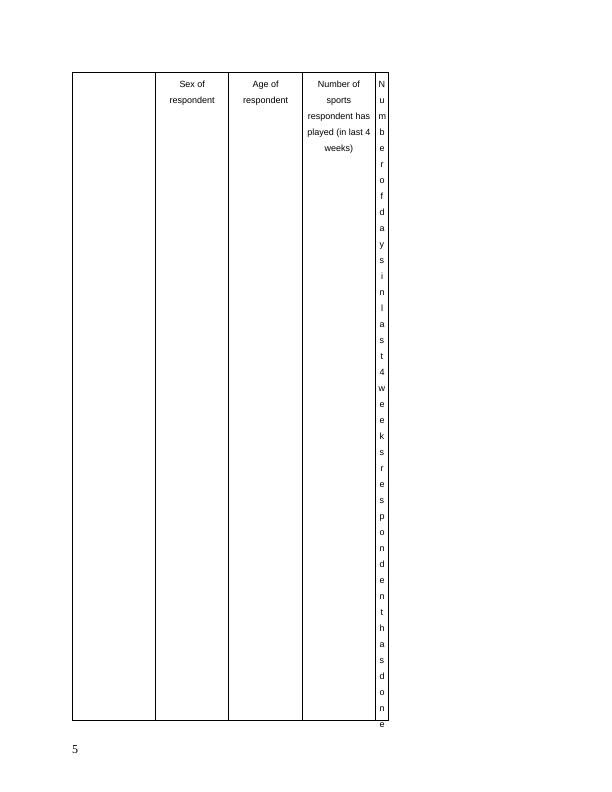
Sex ofrespondentAge ofrespondentNumber ofsportsrespondent hasplayed (in last 4weeks)Numberofdaysinlast4weeksrespondenthasdone5
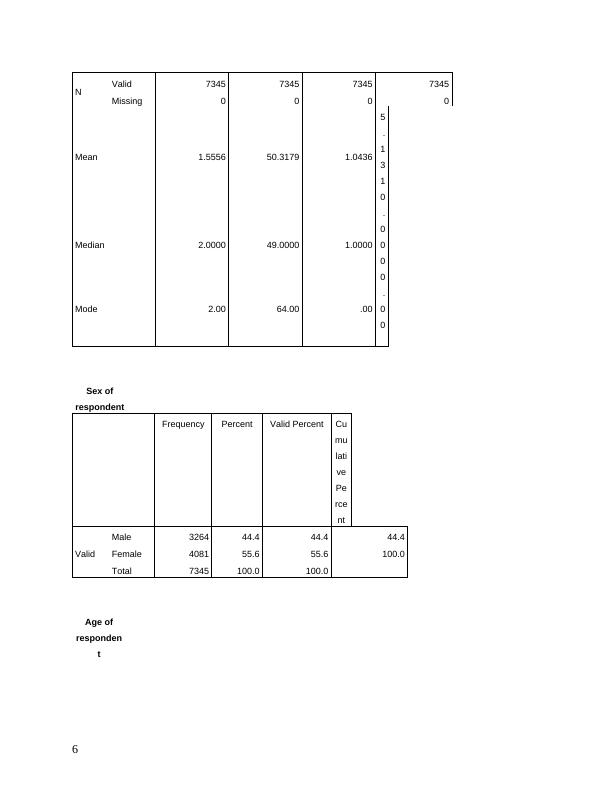
NValid7345734573457345Missing0000Mean1.555650.31791.04365.1310Median2.000049.00001.0000.0000Mode2.0064.00.00.00Sex ofrespondentFrequencyPercentValid PercentCumulativePercentValidMale326444.444.444.4Female408155.655.6100.0Total7345100.0100.0Age ofrespondent6
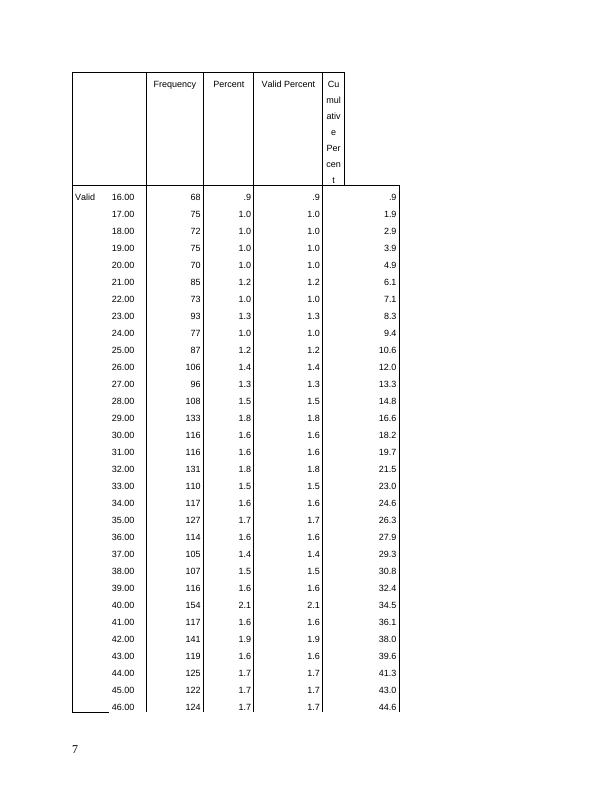
FrequencyPercentValid PercentCumulativePercentValid16.0068.9.9.917.00751.01.01.918.00721.01.02.919.00751.01.03.920.00701.01.04.921.00851.21.26.122.00731.01.07.123.00931.31.38.324.00771.01.09.425.00871.21.210.626.001061.41.412.027.00961.31.313.328.001081.51.514.829.001331.81.816.630.001161.61.618.231.001161.61.619.732.001311.81.821.533.001101.51.523.034.001171.61.624.635.001271.71.726.336.001141.61.627.937.001051.41.429.338.001071.51.530.839.001161.61.632.440.001542.12.134.541.001171.61.636.142.001411.91.938.043.001191.61.639.644.001251.71.741.345.001221.71.743.046.001241.71.744.67
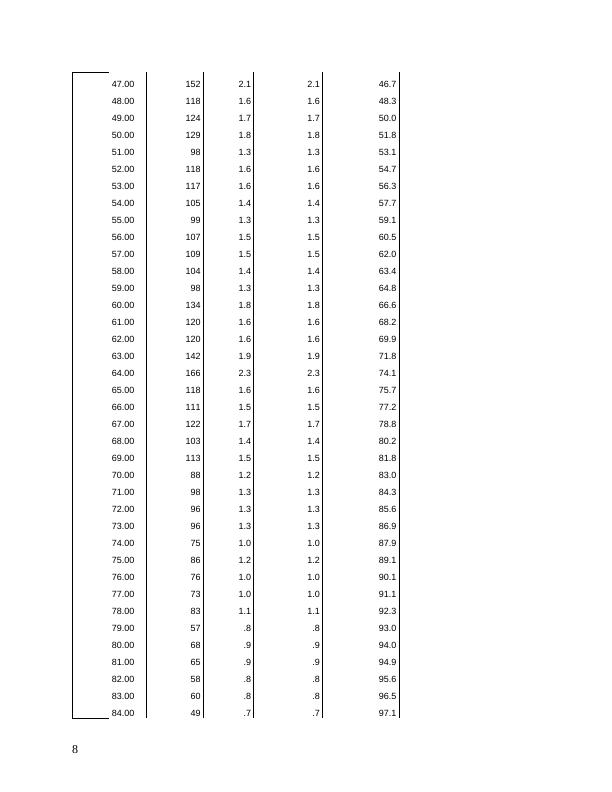
47.001522.12.146.748.001181.61.648.349.001241.71.750.050.001291.81.851.851.00981.31.353.152.001181.61.654.753.001171.61.656.354.001051.41.457.755.00991.31.359.156.001071.51.560.557.001091.51.562.058.001041.41.463.459.00981.31.364.860.001341.81.866.661.001201.61.668.262.001201.61.669.963.001421.91.971.864.001662.32.374.165.001181.61.675.766.001111.51.577.267.001221.71.778.868.001031.41.480.269.001131.51.581.870.00881.21.283.071.00981.31.384.372.00961.31.385.673.00961.31.386.974.00751.01.087.975.00861.21.289.176.00761.01.090.177.00731.01.091.178.00831.11.192.379.0057.8.893.080.0068.9.994.081.0065.9.994.982.0058.8.895.683.0060.8.896.584.0049.7.797.18
End of preview
Want to access all the pages? Upload your documents or become a member.
Related Documents
Research Methods Computer Science : Assignmentlg...
|8
|2174
|171
Analysis of Household Data - Deskliblg...
|11
|1509
|309
Sampling Distribution and Hypothesis Testinglg...
|9
|1369
|177
Statistics for Business and Finance - Desklib Online Librarylg...
|13
|1858
|230
Apply Principles of Statistics Processlg...
|21
|4722
|35
Assignment on Statistics Questionslg...
|9
|1235
|173