KDS Customer Relationship Analysis: A Survey of Self-completion
Added on 2020-02-05
20 Pages4172 Words209 Views
SPSS
TABLE OF CONTENTS
INTRODUCTION................................................................................................................................1
PART 1A..............................................................................................................................................1
1B.........................................................................................................................................................2
MEASUEMENT OF CENTRAL TENDANCY..................................................................................2
1C.........................................................................................................................................................4
ASSUMPTIONS..................................................................................................................................5
ONE WAY ANOVA............................................................................................................................5
Test of Homogeneity of Variances.......................................................................................................6
PART 2 REGRESSION.......................................................................................................................6
REFERENCE.......................................................................................................................................9
APPENDIX........................................................................................................................................10
INTRODUCTION
This report will investigate whether the wealth of KDS customers and whether or not that
the credit they have applied is granted. A survey of self-completion questionnaire was employed.
The questionnaire contained personal details such as age, years of employment, type of
occupation and level of education and many more. Further, the report comprises of two parts in
which first part analyzes and interprets the graphs of SPSS software output of Job income. It will
also comment on summery table and it will give detail about mean, medium and variance,
skewness and kurtosis. Thereafter, the report will run one-way ANOVA, post hoc analysis and t-
test in order to analyze if there is a significant difference of two or more than two population
means such as job status.
PART 1A
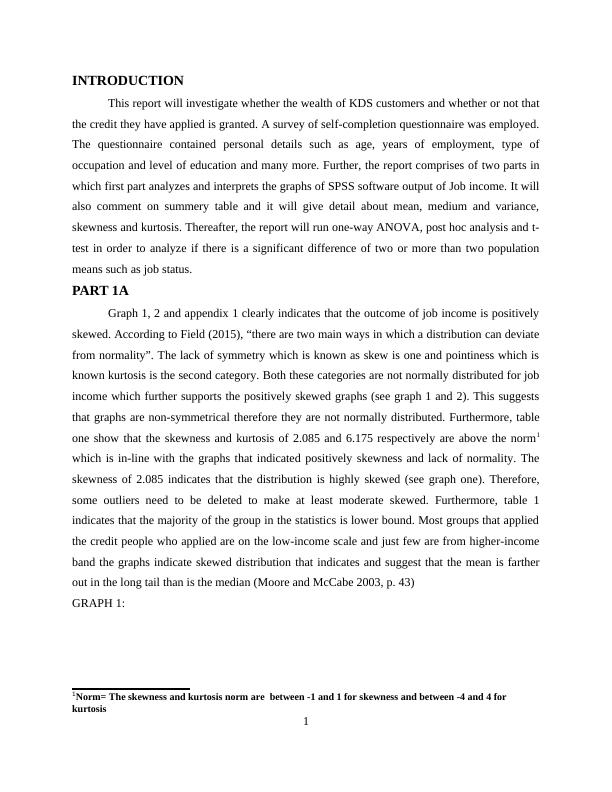
Graph 1, 2 and appendix 1 clearly indicates that the outcome of job income is positively
skewed. According to Field (2015), “there are two main ways in which a distribution can deviate
from normality”. The lack of symmetry which is known as skew is one and pointiness which is
known kurtosis is the second category. Both these categories are not normally distributed for job
income which further supports the positively skewed graphs (see graph 1 and 2). This suggests
that graphs are non-symmetrical therefore they are not normally distributed. Furthermore, table
one show that the skewness and kurtosis of 2.085 and 6.175 respectively are above the norm1
which is in-line with the graphs that indicated positively skewness and lack of normality. The
skewness of 2.085 indicates that the distribution is highly skewed (see graph one). Therefore,
some outliers need to be deleted to make at least moderate skewed. Furthermore, table 1
indicates that the majority of the group in the statistics is lower bound. Most groups that applied
the credit people who applied are on the low-income scale and just few are from higher-income
band the graphs indicate skewed distribution that indicates and suggest that the mean is farther
out in the long tail than is the median (Moore and McCabe 2003, p. 43)
GRAPH 1:
1Norm= The skewness and kurtosis norm are between -1 and 1 for skewness and between -4 and 4 for
kurtosis
1
This report will investigate whether the wealth of KDS customers and whether or not that
the credit they have applied is granted. A survey of self-completion questionnaire was employed.
The questionnaire contained personal details such as age, years of employment, type of
occupation and level of education and many more. Further, the report comprises of two parts in
which first part analyzes and interprets the graphs of SPSS software output of Job income. It will
also comment on summery table and it will give detail about mean, medium and variance,
skewness and kurtosis. Thereafter, the report will run one-way ANOVA, post hoc analysis and t-
test in order to analyze if there is a significant difference of two or more than two population
means such as job status.
PART 1A
Graph 1, 2 and appendix 1 clearly indicates that the outcome of job income is positively
skewed. According to Field (2015), “there are two main ways in which a distribution can deviate
from normality”. The lack of symmetry which is known as skew is one and pointiness which is
known kurtosis is the second category. Both these categories are not normally distributed for job
income which further supports the positively skewed graphs (see graph 1 and 2). This suggests
that graphs are non-symmetrical therefore they are not normally distributed. Furthermore, table
one show that the skewness and kurtosis of 2.085 and 6.175 respectively are above the norm1
which is in-line with the graphs that indicated positively skewness and lack of normality. The
skewness of 2.085 indicates that the distribution is highly skewed (see graph one). Therefore,
some outliers need to be deleted to make at least moderate skewed. Furthermore, table 1
indicates that the majority of the group in the statistics is lower bound. Most groups that applied
the credit people who applied are on the low-income scale and just few are from higher-income
band the graphs indicate skewed distribution that indicates and suggest that the mean is farther
out in the long tail than is the median (Moore and McCabe 2003, p. 43)
GRAPH 1:
1Norm= The skewness and kurtosis norm are between -1 and 1 for skewness and between -4 and 4 for
kurtosis
1
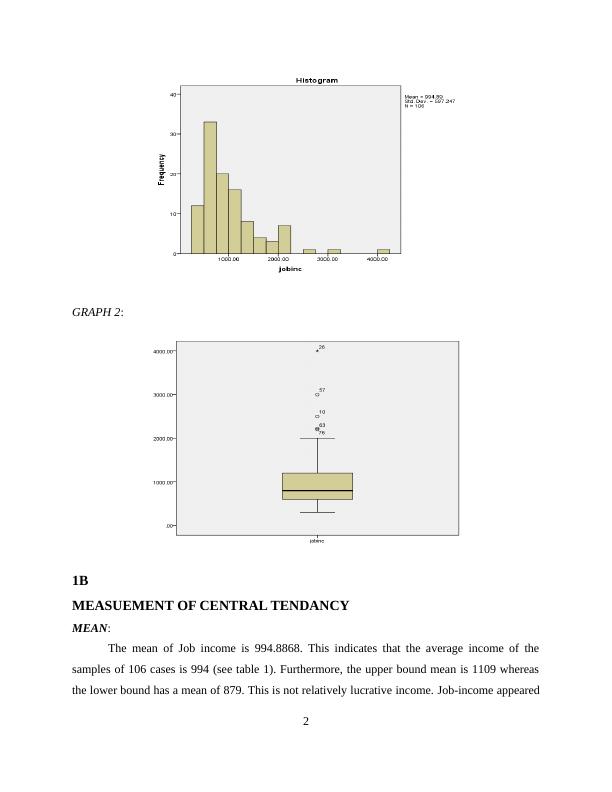
GRAPH 2:
1B
MEASUEMENT OF CENTRAL TENDANCY
MEAN:
The mean of Job income is 994.8868. This indicates that the average income of the
samples of 106 cases is 994 (see table 1). Furthermore, the upper bound mean is 1109 whereas
the lower bound has a mean of 879. This is not relatively lucrative income. Job-income appeared
2
End of preview
Want to access all the pages? Upload your documents or become a member.
Related Documents
SPSS - Statistical Package for the Social Scienceslg...
|12
|1701
|457
Statistical Tests: Mann-Whitney U-test, Wilcoxon matched pairs signed rank test, Kruskal-Wallis test, Friedman testlg...
|9
|1403
|166
Data Visualisation Distribution & Analysis Reportlg...
|16
|1853
|350
Statistics for Business and Finance Examining Household datalg...
|10
|1961
|262
Finance & Funding in Travel Tourism - Assignmentlg...
|13
|686
|120
Sampling Distribution and Hypothesis Testinglg...
|9
|1369
|177