Investigating Diversity's Impact on Kings College Hospital Performance
VerifiedAdded on 2020/03/16
|21
|4011
|1867
Report
AI Summary
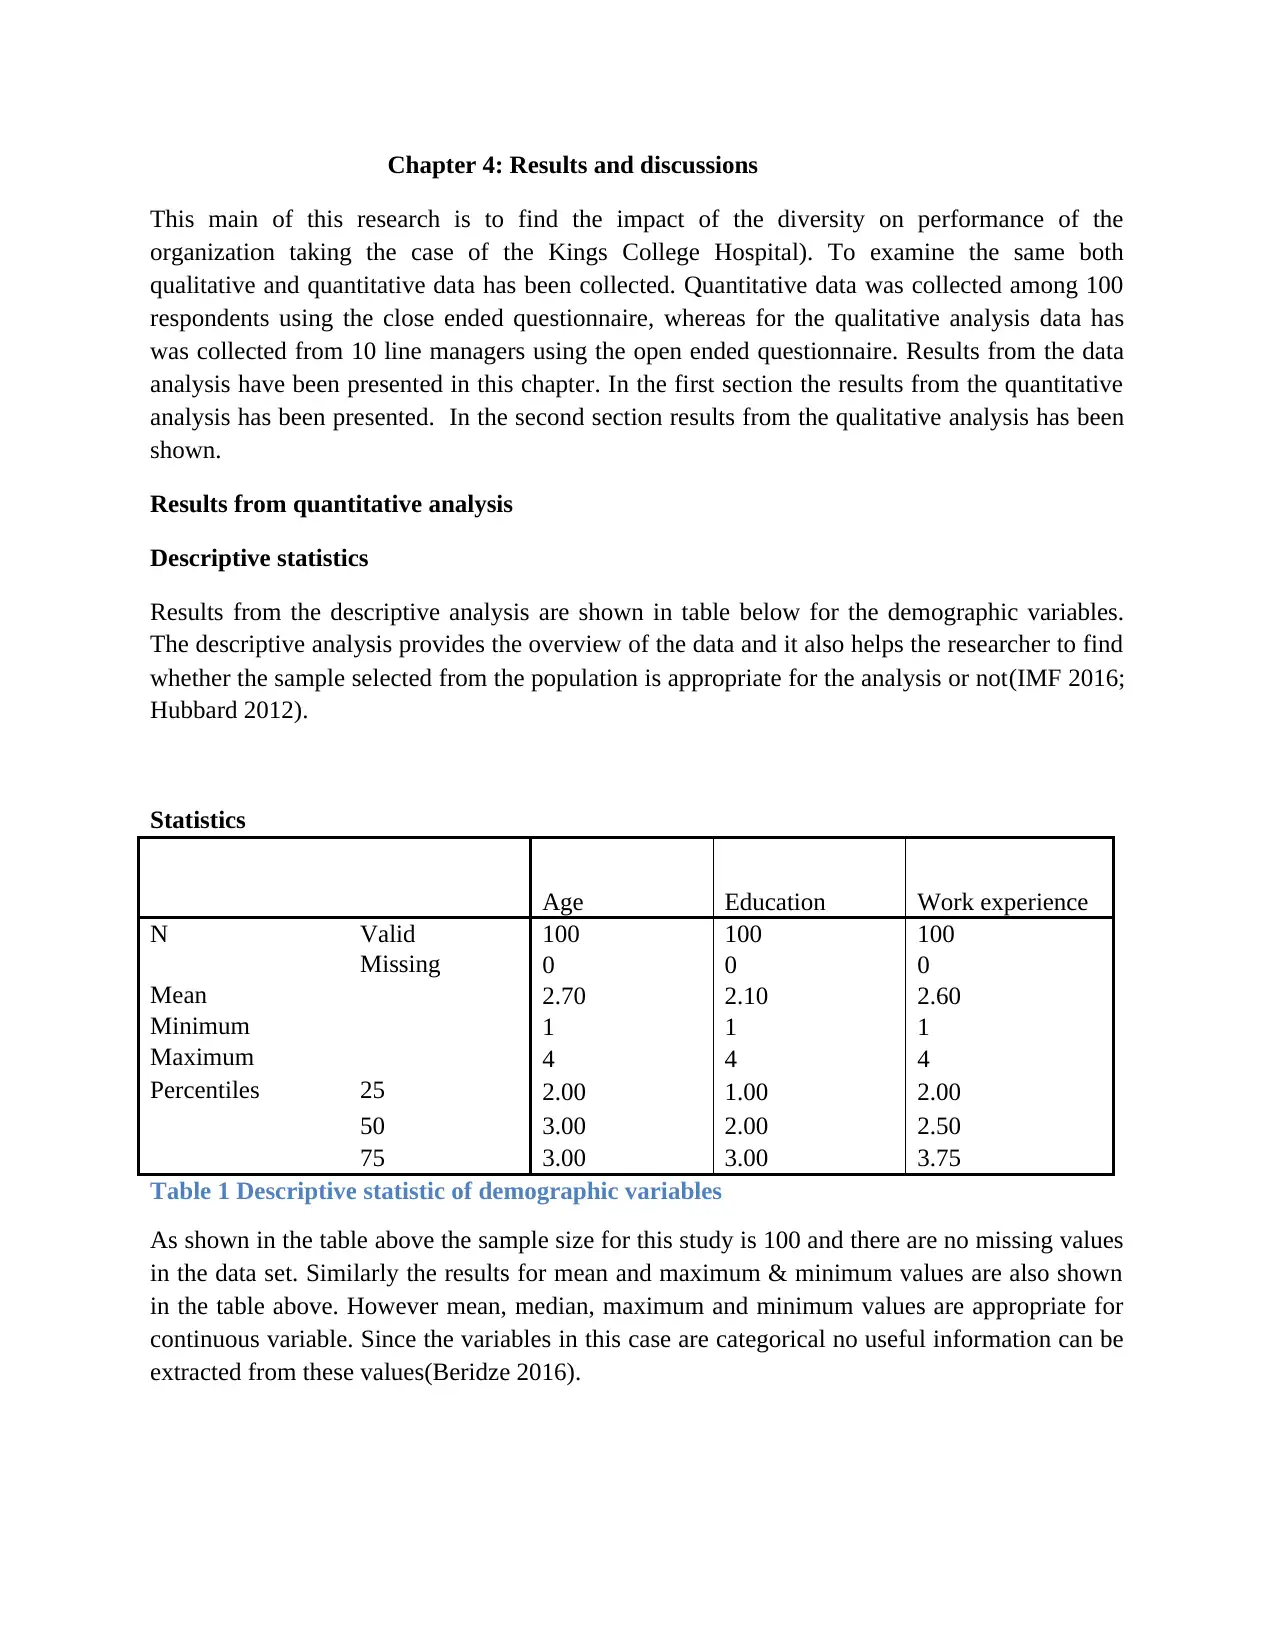
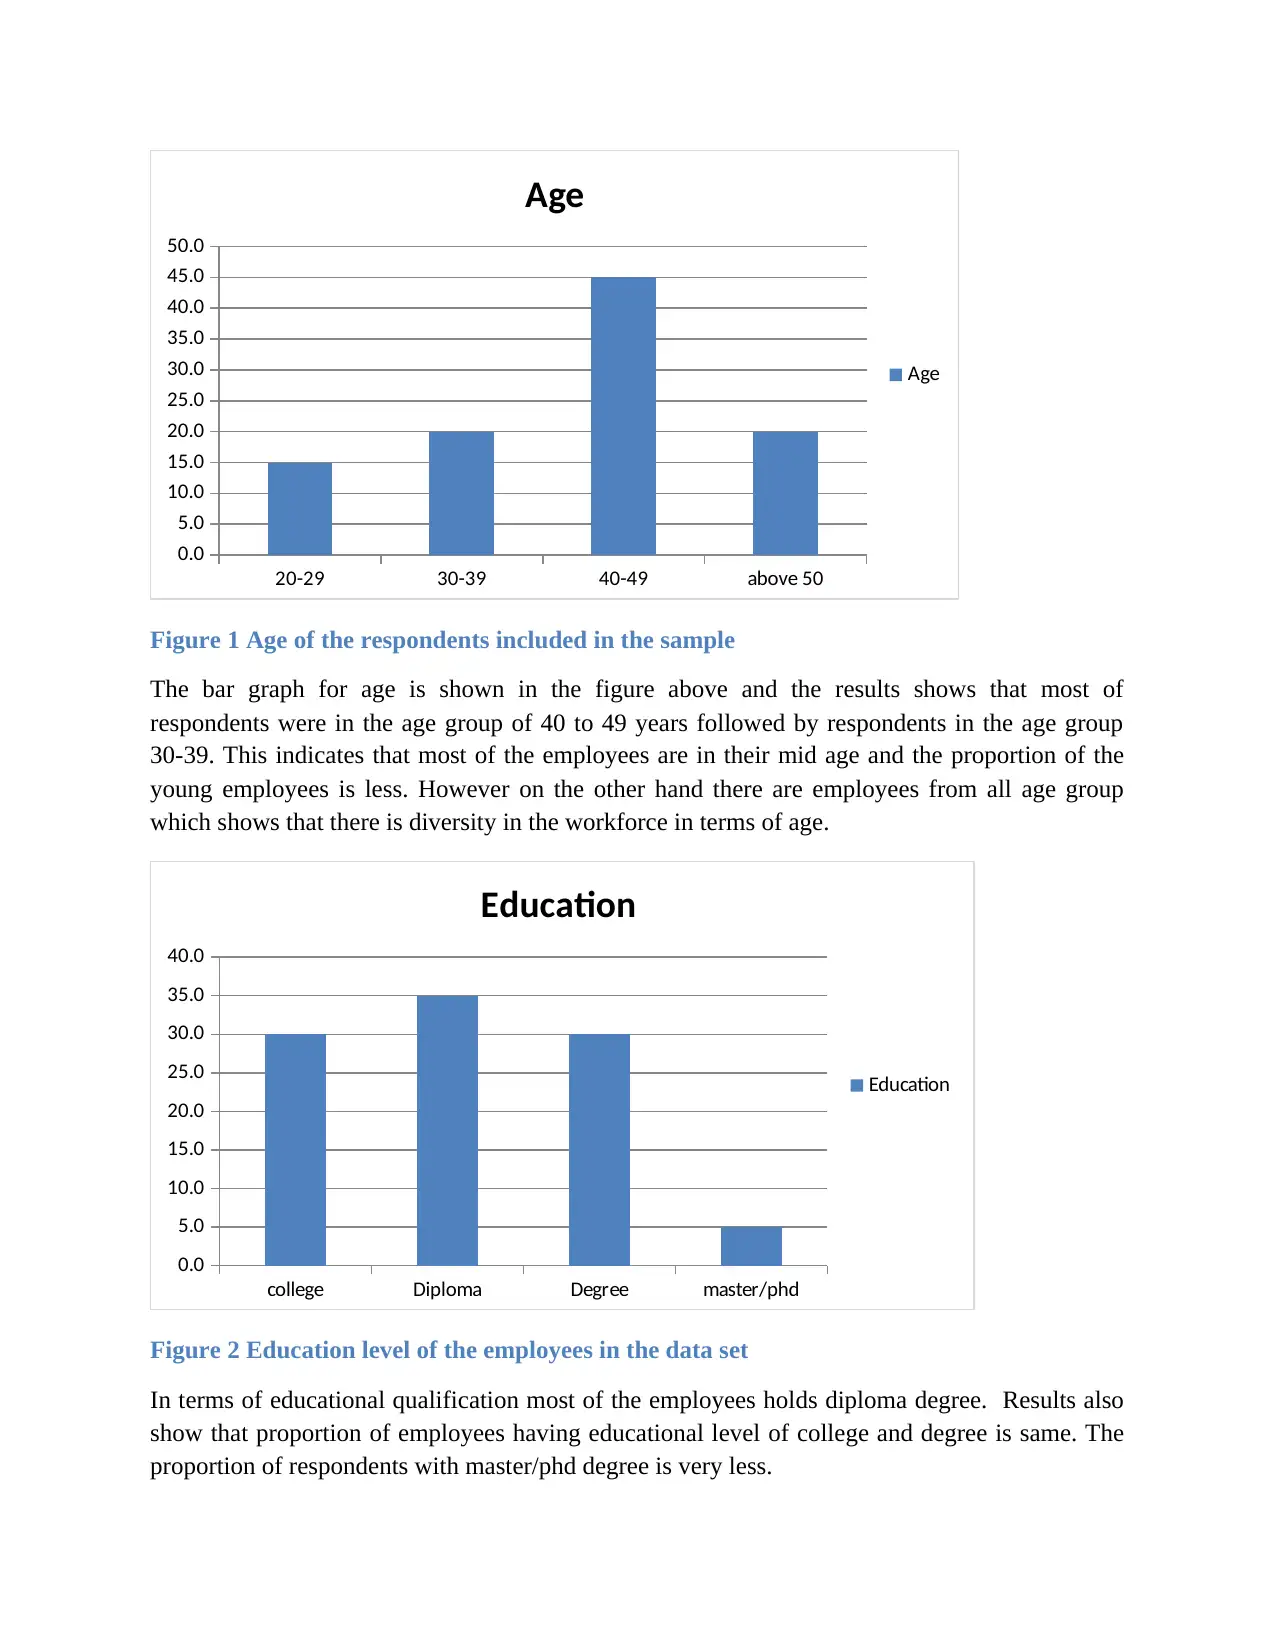
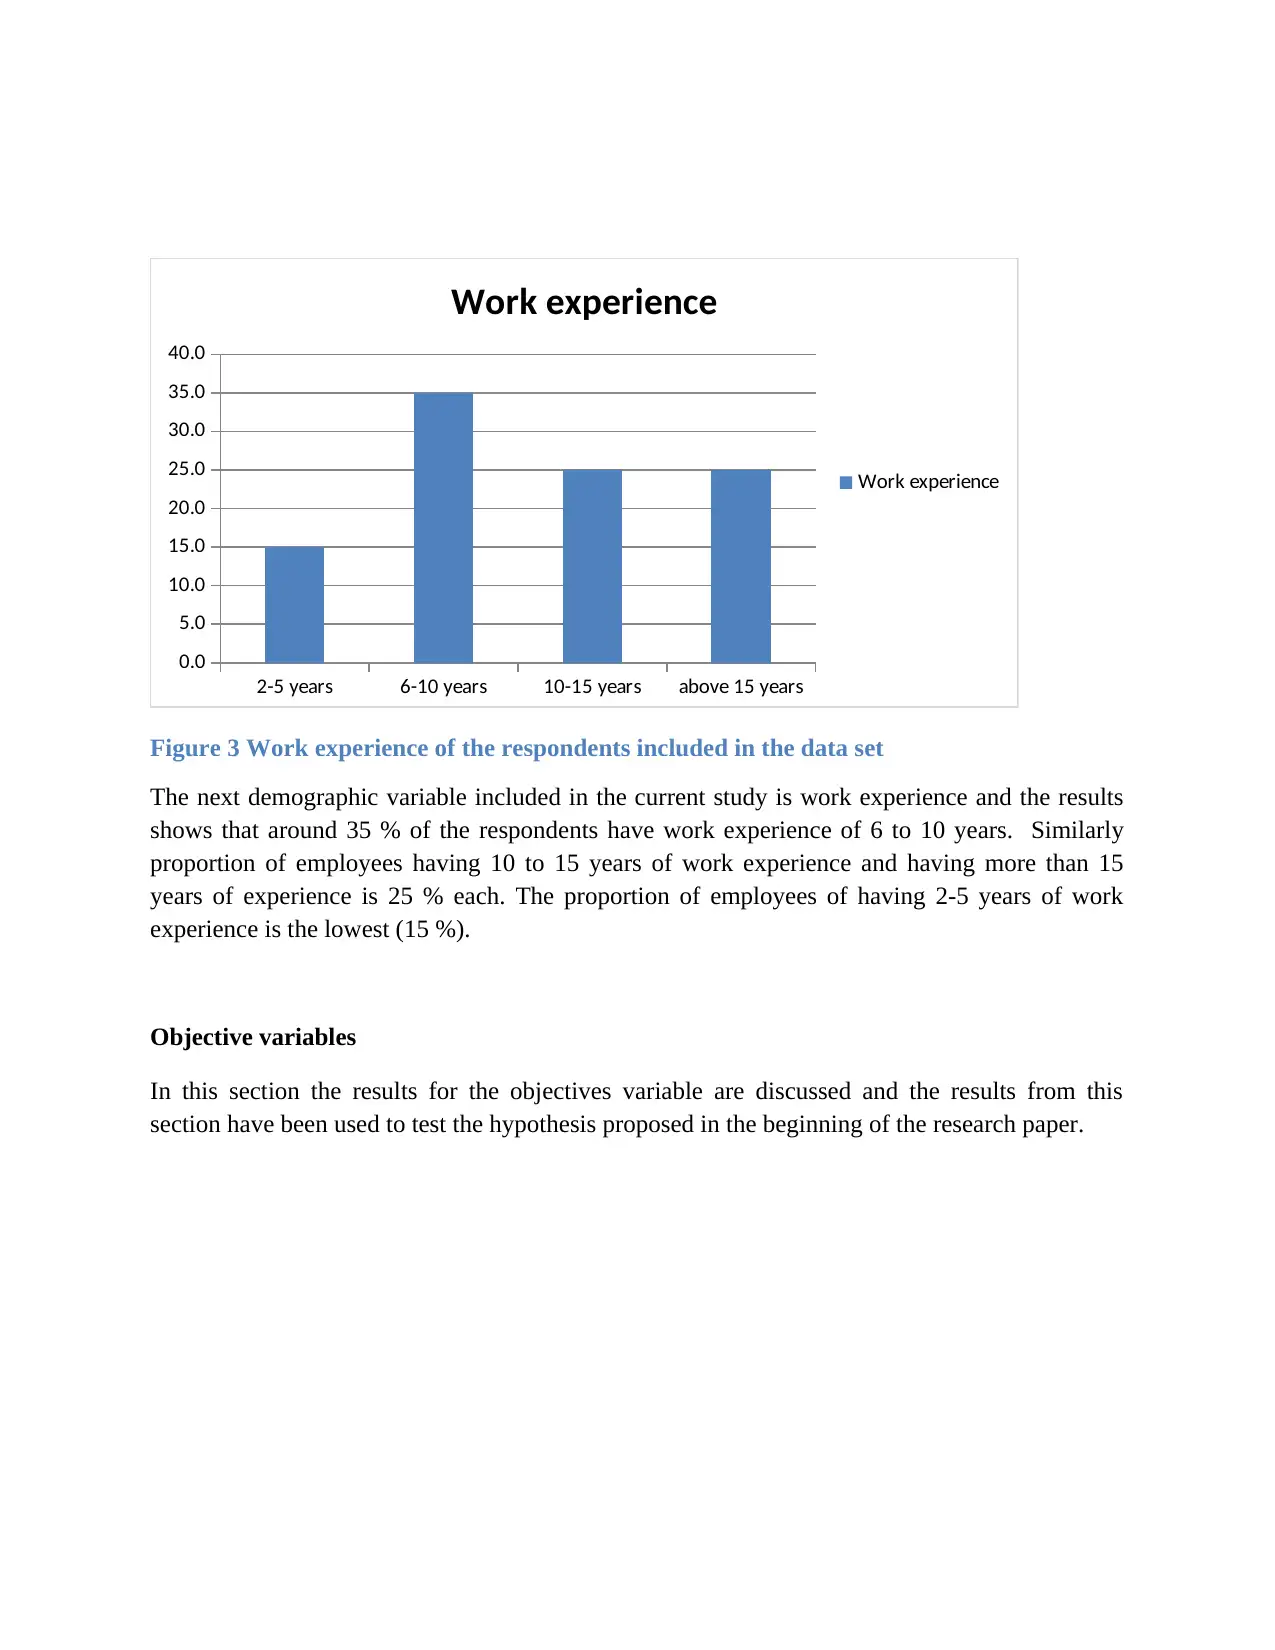
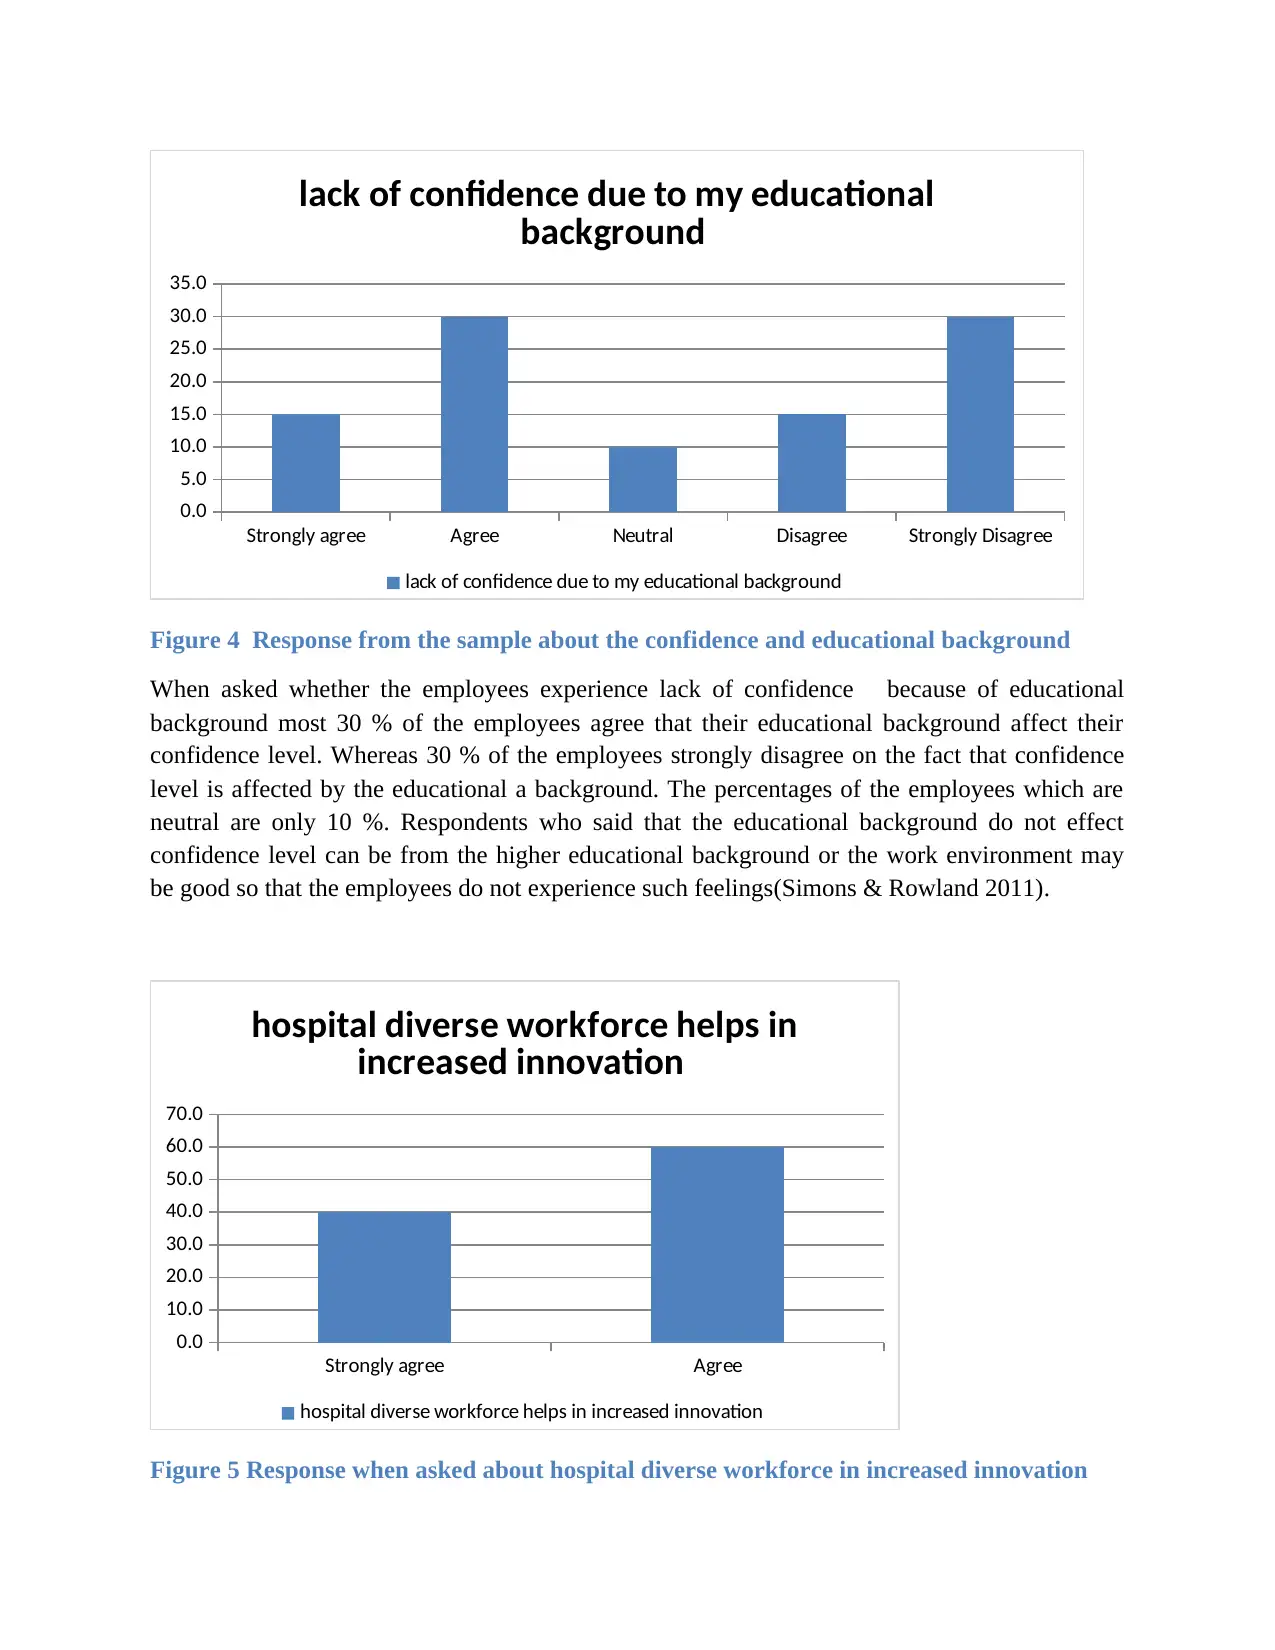
This report presents the results of a study investigating the impact of diversity on organizational performance, using Kings College Hospital as a case study. The research employed both quantitative and qualitative data collection methods, including questionnaires for 100 respondents and open-ended interviews with 10 line managers. The report details descriptive statistics of demographic variables, including age, education, and work experience, illustrating the diversity within the workforce. Key findings reveal employees' perceptions on the impact of educational background on confidence, the positive influence of a diverse workforce on innovation, and the significance of training in fostering awareness about diversity. Inferential analyses, including correlation and regression, were conducted to determine relationships between variables, revealing a positive correlation between organizational performance and diversity. The regression analysis indicated that independent variables explained 95% of the variation in the dependent variable (organizational performance). The report provides valuable insights into the dynamics of diversity within the hospital setting and its influence on various organizational aspects.

Chapter 4: Results and discussions
This main of this research is to find the impact of the diversity on performance of the
organization taking the case of the Kings College Hospital). To examine the same both
qualitative and quantitative data has been collected. Quantitative data was collected among 100
respondents using the close ended questionnaire, whereas for the qualitative analysis data has
was collected from 10 line managers using the open ended questionnaire. Results from the data
analysis have been presented in this chapter. In the first section the results from the quantitative
analysis has been presented. In the second section results from the qualitative analysis has been
shown.
Results from quantitative analysis
Descriptive statistics
Results from the descriptive analysis are shown in table below for the demographic variables.
The descriptive analysis provides the overview of the data and it also helps the researcher to find
whether the sample selected from the population is appropriate for the analysis or not(IMF 2016;
Hubbard 2012).
Statistics
Age Education Work experience
N Valid 100 100 100
Missing 0 0 0
Mean 2.70 2.10 2.60
Minimum 1 1 1
Maximum 4 4 4
Percentiles 25 2.00 1.00 2.00
50 3.00 2.00 2.50
75 3.00 3.00 3.75
Table 1 Descriptive statistic of demographic variables
As shown in the table above the sample size for this study is 100 and there are no missing values
in the data set. Similarly the results for mean and maximum & minimum values are also shown
in the table above. However mean, median, maximum and minimum values are appropriate for
continuous variable. Since the variables in this case are categorical no useful information can be
extracted from these values(Beridze 2016).
Paraphrase This Document
Need a fresh take? Get an instant paraphrase of this document with our AI Paraphraser

20-29 30-39 40-49 above 50
0.0
5.0
10.0
15.0
20.0
25.0
30.0
35.0
40.0
45.0
50.0
Age
Age
Figure 1 Age of the respondents included in the sample
The bar graph for age is shown in the figure above and the results shows that most of
respondents were in the age group of 40 to 49 years followed by respondents in the age group
30-39. This indicates that most of the employees are in their mid age and the proportion of the
young employees is less. However on the other hand there are employees from all age group
which shows that there is diversity in the workforce in terms of age.
college Diploma Degree master/phd
0.0
5.0
10.0
15.0
20.0
25.0
30.0
35.0
40.0
Education
Education
Figure 2 Education level of the employees in the data set
In terms of educational qualification most of the employees holds diploma degree. Results also
show that proportion of employees having educational level of college and degree is same. The
proportion of respondents with master/phd degree is very less.
0.0
5.0
10.0
15.0
20.0
25.0
30.0
35.0
40.0
45.0
50.0
Age
Age
Figure 1 Age of the respondents included in the sample
The bar graph for age is shown in the figure above and the results shows that most of
respondents were in the age group of 40 to 49 years followed by respondents in the age group
30-39. This indicates that most of the employees are in their mid age and the proportion of the
young employees is less. However on the other hand there are employees from all age group
which shows that there is diversity in the workforce in terms of age.
college Diploma Degree master/phd
0.0
5.0
10.0
15.0
20.0
25.0
30.0
35.0
40.0
Education
Education
Figure 2 Education level of the employees in the data set
In terms of educational qualification most of the employees holds diploma degree. Results also
show that proportion of employees having educational level of college and degree is same. The
proportion of respondents with master/phd degree is very less.

2-5 years 6-10 years 10-15 years above 15 years
0.0
5.0
10.0
15.0
20.0
25.0
30.0
35.0
40.0
Work experience
Work experience
Figure 3 Work experience of the respondents included in the data set
The next demographic variable included in the current study is work experience and the results
shows that around 35 % of the respondents have work experience of 6 to 10 years. Similarly
proportion of employees having 10 to 15 years of work experience and having more than 15
years of experience is 25 % each. The proportion of employees of having 2-5 years of work
experience is the lowest (15 %).
Objective variables
In this section the results for the objectives variable are discussed and the results from this
section have been used to test the hypothesis proposed in the beginning of the research paper.
⊘ This is a preview!⊘
Do you want full access?
Subscribe today to unlock all pages.

Trusted by 1+ million students worldwide

Strongly agree Agree Neutral Disagree Strongly Disagree
0.0
5.0
10.0
15.0
20.0
25.0
30.0
35.0
lack of confidence due to my educational
background
lack of confidence due to my educational background
Figure 4 Response from the sample about the confidence and educational background
When asked whether the employees experience lack of confidence because of educational
background most 30 % of the employees agree that their educational background affect their
confidence level. Whereas 30 % of the employees strongly disagree on the fact that confidence
level is affected by the educational a background. The percentages of the employees which are
neutral are only 10 %. Respondents who said that the educational background do not effect
confidence level can be from the higher educational background or the work environment may
be good so that the employees do not experience such feelings(Simons & Rowland 2011).
Strongly agree Agree
0.0
10.0
20.0
30.0
40.0
50.0
60.0
70.0
hospital diverse workforce helps in
increased innovation
hospital diverse workforce helps in increased innovation
Figure 5 Response when asked about hospital diverse workforce in increased innovation
0.0
5.0
10.0
15.0
20.0
25.0
30.0
35.0
lack of confidence due to my educational
background
lack of confidence due to my educational background
Figure 4 Response from the sample about the confidence and educational background
When asked whether the employees experience lack of confidence because of educational
background most 30 % of the employees agree that their educational background affect their
confidence level. Whereas 30 % of the employees strongly disagree on the fact that confidence
level is affected by the educational a background. The percentages of the employees which are
neutral are only 10 %. Respondents who said that the educational background do not effect
confidence level can be from the higher educational background or the work environment may
be good so that the employees do not experience such feelings(Simons & Rowland 2011).
Strongly agree Agree
0.0
10.0
20.0
30.0
40.0
50.0
60.0
70.0
hospital diverse workforce helps in
increased innovation
hospital diverse workforce helps in increased innovation
Figure 5 Response when asked about hospital diverse workforce in increased innovation
Paraphrase This Document
Need a fresh take? Get an instant paraphrase of this document with our AI Paraphraser

Furthermore the respondents were asked whether the diverse workforce helps in increasing
innovation in the workplace all them agreed. In other words all the employees thinks that diverse
workforce helps to increase innovation as the ideas from different group are different and more
creative ideas are developed with people from diverse background as compared to the employees
from the same background.
Strongly agree Agree Neutral Disagree Strongly
Disagree
0.0
5.0
10.0
15.0
20.0
25.0
30.0
35.0
40.0
45.0
organization is defined by the diverse
workforce
organization is defined by the diverse workforce
Figure 6 Response related to diversity in the workforce
Similarly when asked whether the structure of the organization is defined by diverse workforce,
40 % of the employees agree and 20 % strongly agree that structure of organization is defined by
diverse workforce. On the other and 10 % of the employees disagree and % strongly disagrees
on the same. However majority of the employees agree so it can be concluded that the diverse
workforce is used do define the structure of the organization.

Strongly agree Agree Neutral
0.0
5.0
10.0
15.0
20.0
25.0
30.0
35.0
40.0
45.0
50.0
Training that are undertaken by
staffs helps in diversity awareness
training that are undertaken by staffs helps in diversity awareness
Figure 7 Responses related to the training for staff and diversity
During the primary survey one of the questions asked was whether the training undertaken by the
employees in the organization helps in the awareness about diversity. As shown in the figure
above more than 40 % of the employees agree that training helps in improving awareness about
diversity and 40 % of the employees strongly agree. Remaining employees were neutral. It also
shows that none of the employees disagree with the given statement(Bed et al. 2014).
Strongly agree Agree Neutral
0.0
10.0
20.0
30.0
40.0
50.0
60.0
Younger employees benefit from
shared experience
Younger employees benefit from shared experience
Figure 8 Response for benefit for younger employees
0.0
5.0
10.0
15.0
20.0
25.0
30.0
35.0
40.0
45.0
50.0
Training that are undertaken by
staffs helps in diversity awareness
training that are undertaken by staffs helps in diversity awareness
Figure 7 Responses related to the training for staff and diversity
During the primary survey one of the questions asked was whether the training undertaken by the
employees in the organization helps in the awareness about diversity. As shown in the figure
above more than 40 % of the employees agree that training helps in improving awareness about
diversity and 40 % of the employees strongly agree. Remaining employees were neutral. It also
shows that none of the employees disagree with the given statement(Bed et al. 2014).
Strongly agree Agree Neutral
0.0
10.0
20.0
30.0
40.0
50.0
60.0
Younger employees benefit from
shared experience
Younger employees benefit from shared experience
Figure 8 Response for benefit for younger employees
⊘ This is a preview!⊘
Do you want full access?
Subscribe today to unlock all pages.

Trusted by 1+ million students worldwide

Similarly the response for from the employees about the younger employees benefit from shared
experience or not, is shown in the figure above. Results show that around 80 % of the employees
agreed that the younger employees benefits while working with the experienced one as it helps
the younger employee to learn about the work and organization more. None of the employees
disagree with the fact.
Strongly agree Agree Neutral Disagree Strongly
Disagree
0.0
10.0
20.0
30.0
40.0
50.0
60.0
It is very difficult to communicate
with diverse colleagues
It is very difficult to communicate with diverse colleagues
Figure 9 Responses for communication in diverse workforce
When asked whether it is difficult to communication if there are diverse colleagues in the
organization, half of the respondents disagree and 10 % strongly disagree. This shows that
communication is not the problem in organization with diverse colleagues. Only around 30 % of
the employees argued that communication is difficult in diverse workforce.
Paraphrase This Document
Need a fresh take? Get an instant paraphrase of this document with our AI Paraphraser

Strongly agree Agree
0.0
10.0
20.0
30.0
40.0
50.0
60.0
70.0
hospital provides one of the best
frontline services
hospital provides one of the best frontline services
Figure 10 Response for hospital performance
Another question in the questionnaire was related to the performance of the frontline services in
South East London. As the results show in the above figure none of the respondents disagree
which shows that the services provided by the hospital provides quality services. Among the
respondents who agree 60 % strongly agree to the given statement. One of the main reason
behind such results may be because all the respondents are from the same organization so they
do not want to come up against the own organization. Also the quality of the frontline service
may be good which the reason behind such results is.
Strongly agree Agree Neutral Disagree
0.0
5.0
10.0
15.0
20.0
25.0
30.0
35.0
40.0
45.0
Younger employee assist older
employees on technological changes
Younger employee assist older employees on technological changes
Figure 11 Response for younger employees helping the older for technological changes
0.0
10.0
20.0
30.0
40.0
50.0
60.0
70.0
hospital provides one of the best
frontline services
hospital provides one of the best frontline services
Figure 10 Response for hospital performance
Another question in the questionnaire was related to the performance of the frontline services in
South East London. As the results show in the above figure none of the respondents disagree
which shows that the services provided by the hospital provides quality services. Among the
respondents who agree 60 % strongly agree to the given statement. One of the main reason
behind such results may be because all the respondents are from the same organization so they
do not want to come up against the own organization. Also the quality of the frontline service
may be good which the reason behind such results is.
Strongly agree Agree Neutral Disagree
0.0
5.0
10.0
15.0
20.0
25.0
30.0
35.0
40.0
45.0
Younger employee assist older
employees on technological changes
Younger employee assist older employees on technological changes
Figure 11 Response for younger employees helping the older for technological changes

Above figure shows the response of the employees when asked whether the older employees
assist the older employees on technological changes. Results show that 40 % of the employees
think that the younger employees do not help the older employees whereas 30 % agree with the
given statement. This shows that the relationship between the older and younger employees in
the organization cannot be defined as good or bad. In some cases the younger ones are helping
the older one whereas in some cased they are not helping(Soni & Ashish 2016; Govitvatana
2001).
9-13 14-18 19-23 24-28
0.0
5.0
10.0
15.0
20.0
25.0
30.0
35.0
Nominal age of young patients
Figure 12 Nominal age of the young patients in the hospital
Results for the nominal age of the young patients in the hospital show that most of the patients
are in the age group of 24 to 28 years. This is followed by the patients in the age group of 14-18
years. Patients in the age group of 19-23 are 15 %, which is lowest among all the age group.
50-55 55-60 61-65 66-70
0.0
5.0
10.0
15.0
20.0
25.0
30.0
35.0
Mnimum age of old patients
Mnimum age of old
patients
⊘ This is a preview!⊘
Do you want full access?
Subscribe today to unlock all pages.

Trusted by 1+ million students worldwide

Figure 13 Minimum age of the old patients in the hospitals
Lastly the minimum age of the old patients in the hospital is shown in the figure above . Results
show that most of the patients are in the age group of 66-70 years followed by the patients in 50-
55 years.
Inferential analysis
In the previous section the descriptive results for the variables included in the study has been
shown and this section will be used to discuss the results from the inferential analysis. The
inferential analysis has been performed using correlation and regression.
Reliability Analysis
Reliability Statistics
Cronbach's Alpha N of Items
.939 7
Table 2 Reliability analysis
Since the value of alpha is higher than the minimum required of 0.6 so the variables are reliable ,
so further analysis can be conducted.
Correlation
Correlation analysis is performed to find the relationship between the variables in the study. The
value for correlation between two variables ranges from -1 to +1. The correlation of -1 indicates
that the perfect negative relationship exists between the variables. On the other hand, correlation
value of +1 show that there exist perfect positive relationship(Mukaka 2012).
In this case the correlation between the organization performance and the diversity in the
organization is shown in the table below:
Correlations
increase
d
innovati
on_2
diverse_w
rkfc_3
diverse_aw
rnes_4`
shared_e
xp_5
diverse_coll
eague_6
young_old_
assist_8
increased
innovation_2
Pearso
n
Correl
ation
1 .699** .877** .758** .892** .861**
Paraphrase This Document
Need a fresh take? Get an instant paraphrase of this document with our AI Paraphraser

Sig.
(2-
tailed)
.000 .000 .000 .000 .000
N 100 100 100 100 100 100
diverse_wrkf
c_3
Pearso
n
Correl
ation
.699** 1 .855** .847** .838** .858**
Sig.
(2-
tailed)
.000 .000 .000 .000 .000
N 100 100 100 100 100 100
diverse_awr
nes_4`
Pearso
n
Correl
ation
.877** .855** 1 .870** .864** .839**
Sig.
(2-
tailed)
.000 .000 .000 .000 .000
N 100 100 100 100 100 100
shared_exp_
5
Pearso
n
Correl
ation
.758** .847** .870** 1 .883** .848**
Sig.
(2-
tailed)
.000 .000 .000 .000 .000
N 100 100 100 100 100 100
diverse_colle
ague_6
Pearso
n
Correl
ation
.892** .838** .864** .883** 1 .871**
Sig.
(2-
tailed)
.000 .000 .000 .000 .000
N 100 100 100 100 100 100
young_old_a
ssist_8
Pearso
n
Correl
ation
.861** .858** .839** .848** .871** 1
(2-
tailed)
.000 .000 .000 .000 .000
N 100 100 100 100 100 100
diverse_wrkf
c_3
Pearso
n
Correl
ation
.699** 1 .855** .847** .838** .858**
Sig.
(2-
tailed)
.000 .000 .000 .000 .000
N 100 100 100 100 100 100
diverse_awr
nes_4`
Pearso
n
Correl
ation
.877** .855** 1 .870** .864** .839**
Sig.
(2-
tailed)
.000 .000 .000 .000 .000
N 100 100 100 100 100 100
shared_exp_
5
Pearso
n
Correl
ation
.758** .847** .870** 1 .883** .848**
Sig.
(2-
tailed)
.000 .000 .000 .000 .000
N 100 100 100 100 100 100
diverse_colle
ague_6
Pearso
n
Correl
ation
.892** .838** .864** .883** 1 .871**
Sig.
(2-
tailed)
.000 .000 .000 .000 .000
N 100 100 100 100 100 100
young_old_a
ssist_8
Pearso
n
Correl
ation
.861** .858** .839** .848** .871** 1

Sig.
(2-
tailed)
.000 .000 .000 .000 .000
N 100 100 100 100 100 100
**. Correlation is significant at the 0.01 level (2-tailed).
Table 3 Results from the correlation analysis
Correlations
increased
innovation_2
Age Edu_backgrn
d_1
increased
innovation_2
Pearson
Correlation
1 .813** .834**
Sig. (2-tailed) .000 .000
N 100 100 100
Age
Pearson
Correlation
.813** 1 .874**
Sig. (2-tailed) .000 .000
N 100 100 100
Edu_backgrnd_1
Pearson
Correlation
.834** .874** 1
Sig. (2-tailed) .000 .000
N 100 100 100
**. Correlation is significant at the 0.01 level (2-tailed).
Table 4 Correlation results for demographic variable and organizational performance
Results show that most of the correlation coefficients are positive and also statistically
significant. This suggests that the organizational performance and the diversity are positively
correlated, so if diversity in the workplace increases the performance of the organization also
improves. Since the correlation results are significant further analysis can be conducted.
Regression
Regression analysis is conducted to find the impact of the independent variables on the
dependent variables. In this case the dependent variable is the organizational performance which
is measure by the increase in innovation in the organization with increase in diversity in the work
force. Similarly the independent variables include all the factors related to diversity in the study.
Results from the regression analysis are shown in the table below:
⊘ This is a preview!⊘
Do you want full access?
Subscribe today to unlock all pages.

Trusted by 1+ million students worldwide
1 out of 21
Related Documents

Your All-in-One AI-Powered Toolkit for Academic Success.
+13062052269
info@desklib.com
Available 24*7 on WhatsApp / Email
Unlock your academic potential
Copyright © 2020–2025 A2Z Services. All Rights Reserved. Developed and managed by ZUCOL.