(Doc) Statistics for Management Assignment
23 Pages4220 Words39 Views
Added on 2020-11-23
(Doc) Statistics for Management Assignment
Added on 2020-11-23
ShareRelated Documents
STATISTICS FORMANAGEMENT
Table of ContentsINTRODUCTION...........................................................................................................................3ACTIVITY 1....................................................................................................................................3a) National Statistical Data..........................................................................................................3b) Graphical and tabular representation of data acquired form Office of National Statistics.....6c) Differences between CPI, CPIH and RPI Indices...................................................................8d) Use of data collected form CPI subject to evaluate the annual inflation................................8e) Importance of rate of inflation and requirement.....................................................................8ACTIVITY 2....................................................................................................................................9a) Use of ogive and median hourly earnings and the quartiles, mean and standard deviation...9b) Mean and standard deviation for hourly earnings of London area.......................................11c) Comparison of earning of London and Manchester area......................................................13ACTIVITY 3..................................................................................................................................13a) Evaluation of economic order quantity.................................................................................13b) Assessment of requirement of re-ordering T-Shirts.............................................................15c) The inventory policy cost......................................................................................................15d) Current service level to the customers..................................................................................16e) Work out for the reorder level to accomplishment of desired service level.........................16ACTIVITY 4..................................................................................................................................16a) The Office of the National Statistics produce line................................................................16b) Data used form activity 2 to produce an ogive for cumulative % of staff vs hourly earnings...................................................................................................................................................18CONSLUSION..............................................................................................................................18REFERENCES..............................................................................................................................19
INTRODUCTIONStatistics is a technique of analysing and presenting numerical data using tools andtechniques which can lead in effective graphical representation. Statistics is a process which isused by managers in a business organisation to analyse and interpret the data of there variousprocesses such as production, selling, demand, supply and many more. Main aim of this projectreport is to use statistical tools such as graphs, charts and curves to represent informationprovided. In this project report, various activities are conducted to compare and analyse data.Data of consumer price index and retail price index is procured in order to represent theircomparison. Further, the concept of economic order quantity is also been discussed by presentinga scatter diagram using provided information. Data from Office of National Statistics is alsoanalysed to indicate change in CPI, CPIH and RPI. The concept of inflation is also analysed inthis report using annual inflation method. Various business management processes are used withan integrated approach of statistics, so reliable results can be attained.ACTIVITY 1a) National Statistical DataInflation can be stated as quantitative measure of rate on which average price of aparticular set of commodities increases in a certain period of time. In general, it also indicates thedecreases in buying power of currency of nations (Bedeian, 2014). When price of products risethen it majorly impact on cost of living of people. In this regard authorities of country likeCentral Bank take necessary actions in order to control hiked price within permissible limits. Ithelps in running economy more smoothly. Along with this, inflation rate can measure by variousinitiatives, it includes- Consumer Price Indices (CPI), Retail price Index and CPIH. Consumer Price Indices: CPI refers to a measure which determines weighted average ofprice of particular bulk of products. It includes basic commodities like foodstuffs, transportation,education, communication, medical care etc. In general, statisticians and organisations use CPImethod to measure inflation or deflation rate which impact on buying power of nationalcurrency. This concept is widely used as an indicator of economy which suggests government
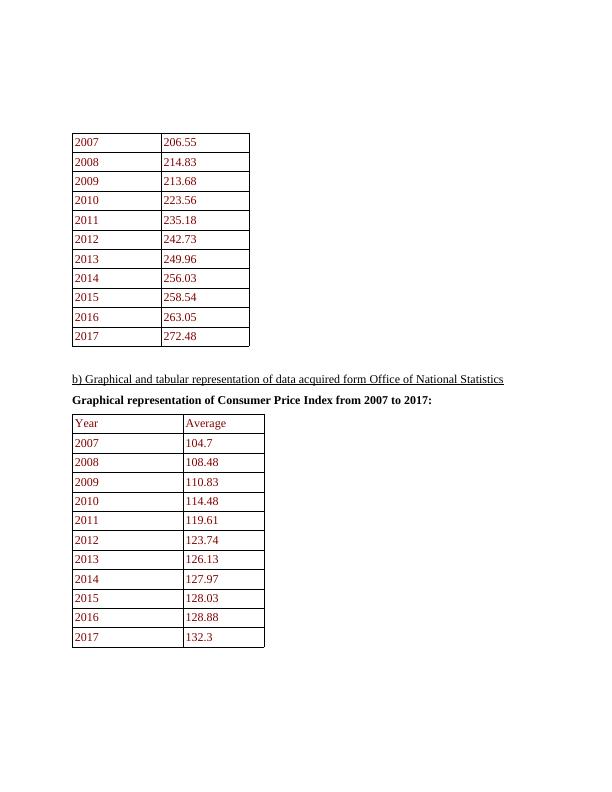
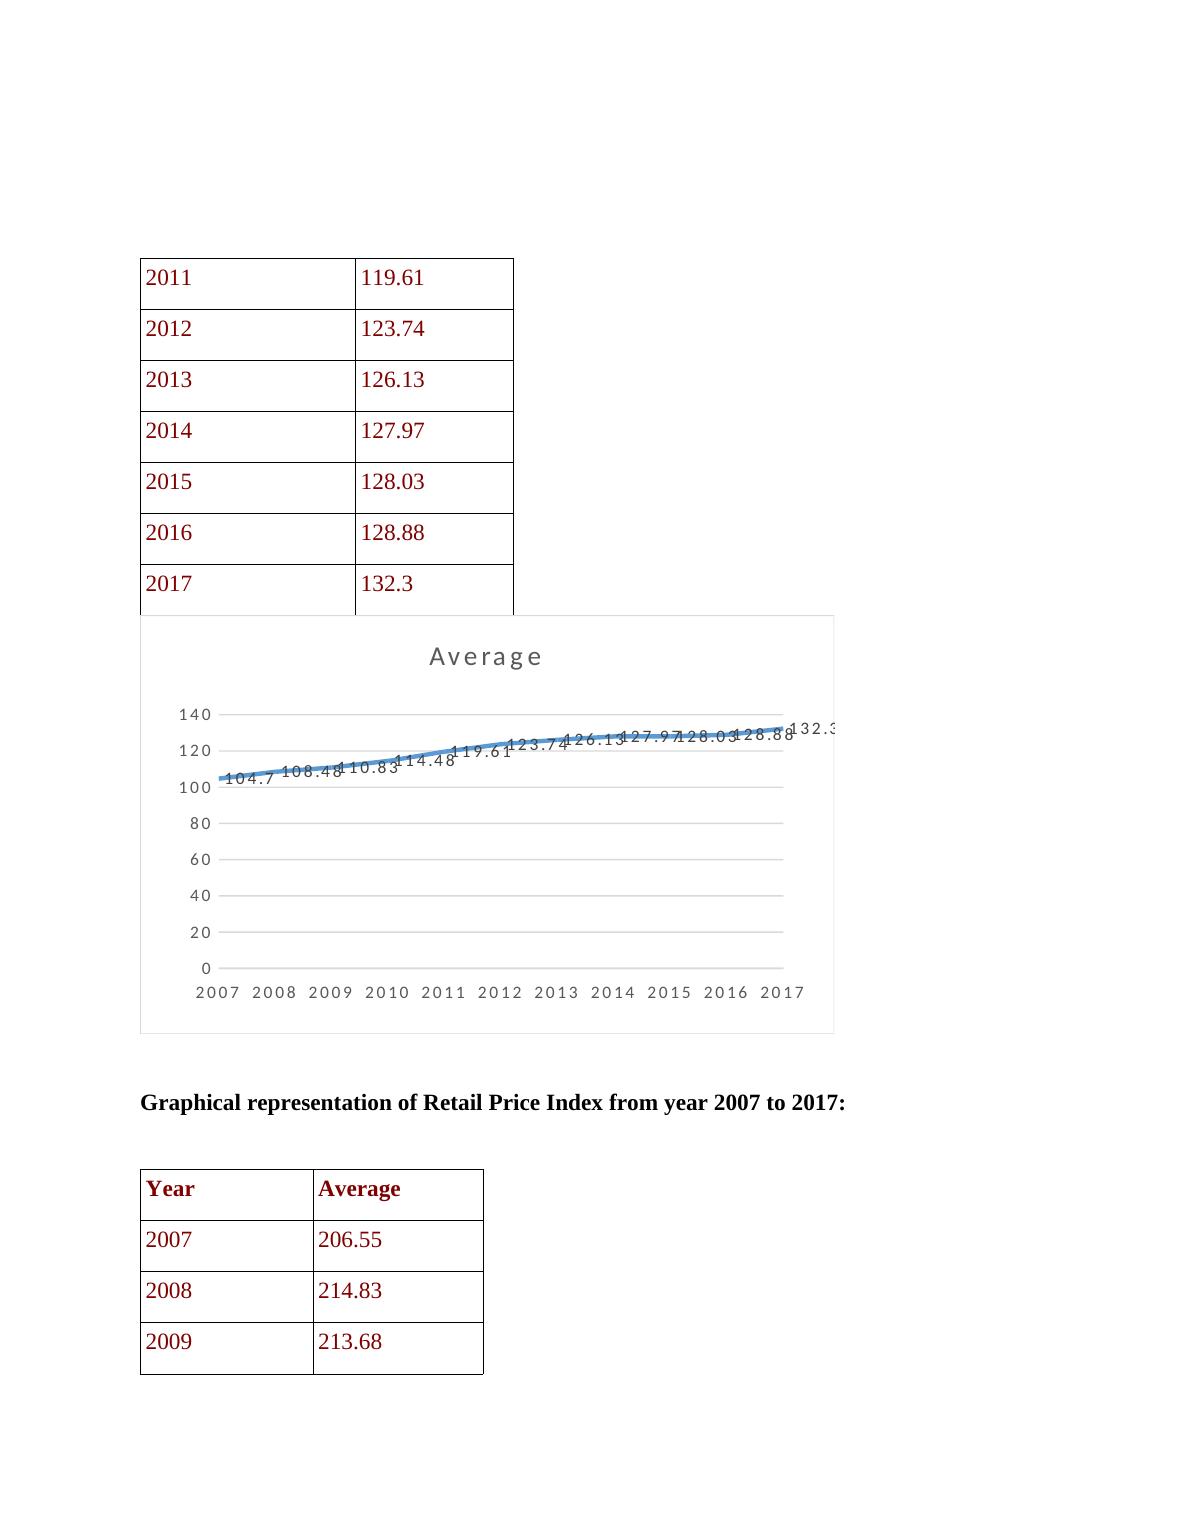
authorities an idea about changing price in particular period. Therefore, in order to control theprice, they can take effective decisions (Barrett and et. al., 2012). Furthermore, CPI statisticsusually include unemployed, self-employed and retired people who will face major issues whenprice of basic necessities are rise. CPIH: It includes same concept as CPI, the only difference is that CPIH includesinflation which contains the occupancies for housing cost. This measure is used to examine thechanges in cost of living and movement of price of products like household goods, food itemsand more. Retail Price Index: RPI refers to one of the main measures of customer inflation whichis produced by national statistics. This kind of data is mostly used by government authorities fordifferent purposes such as wage negotiation, inflation and deflation rates, amount payable onindex-linked securities. Statistical data in terms of CPI indexYearAverage2007104.72008108.482009110.832010114.482011119.612012123.742013126.132014127.972015128.032016128.882017132.3Statistical data in terms of RPI IndexYearAverage
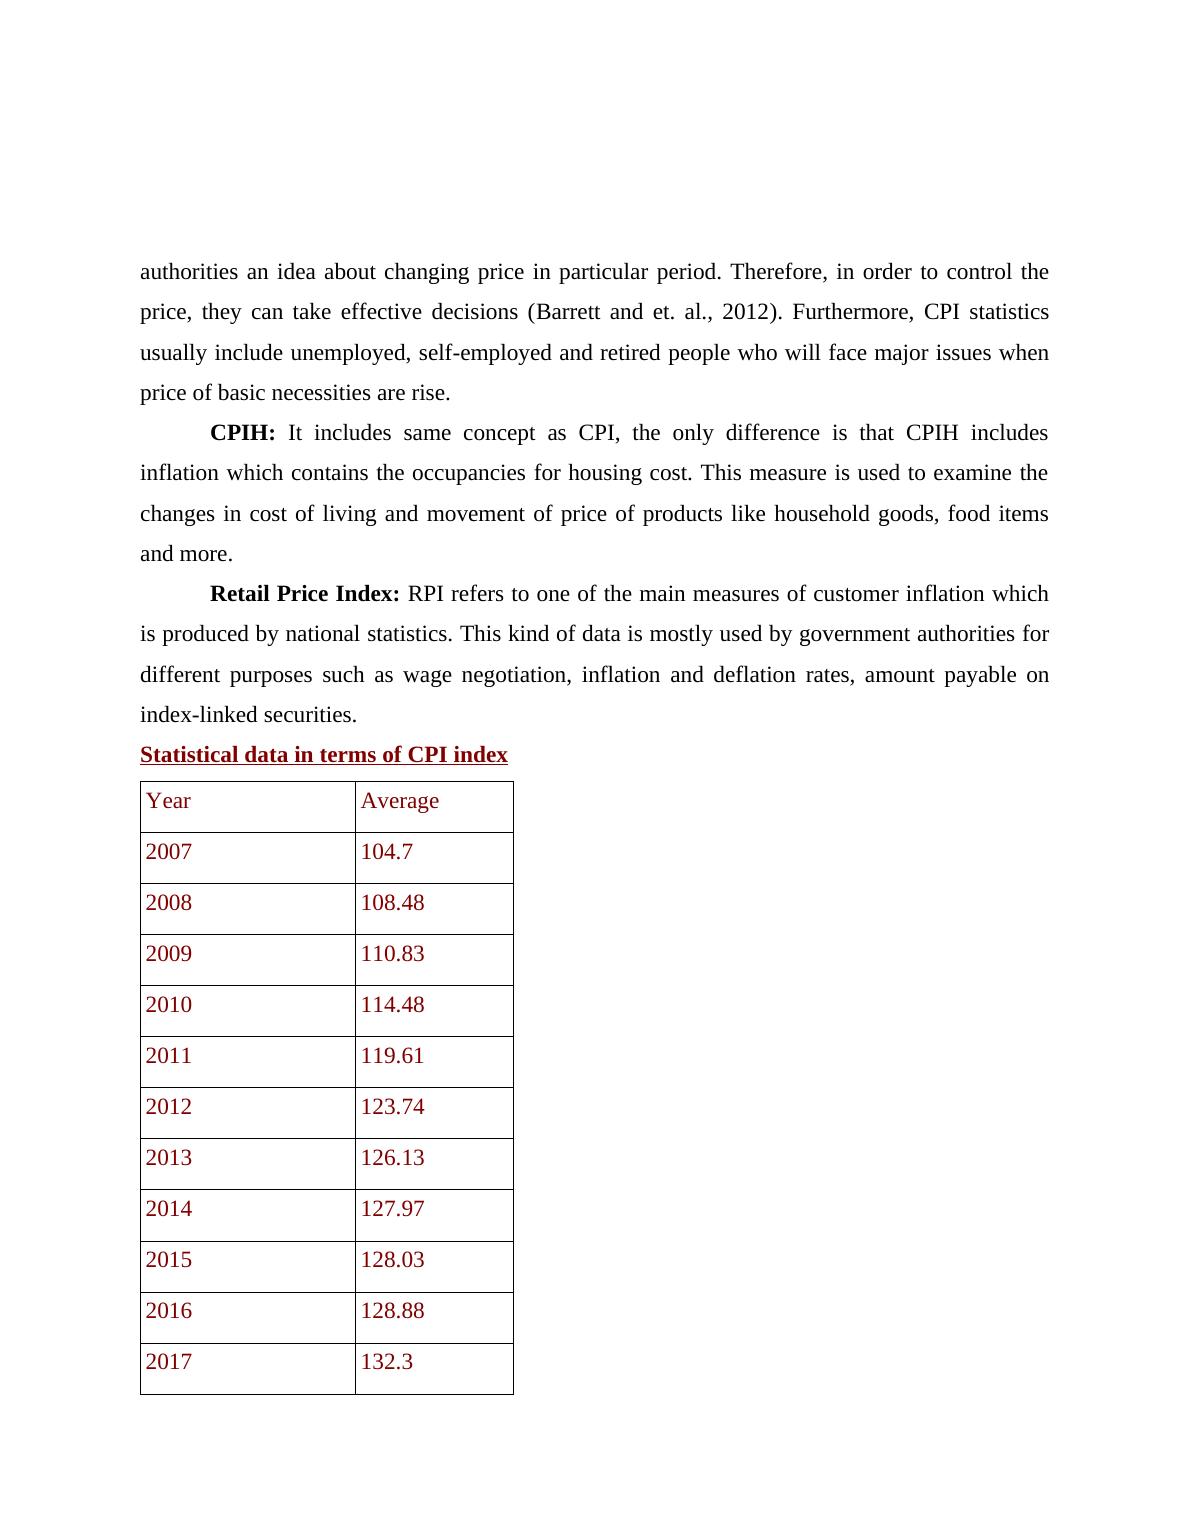
2007206.552008214.832009213.682010223.562011235.182012242.732013249.962014256.032015258.542016263.052017272.48b) Graphical and tabular representation of data acquired form Office of National StatisticsGraphical representation of Consumer Price Index from 2007 to 2017:YearAverage2007104.72008108.482009110.832010114.482011119.612012123.742013126.132014127.972015128.032016128.882017132.3
20072008200920102011201220132014201520162017020406080100120140104.7108.48110.83114.48119.61123.74126.13127.97128.03128.88132.3AverageGraphical representation of Retail Price Index from year 2007 to 2017:YearAverage2007206.552008214.832009213.682010223.562011235.182012242.732013249.962014256.032015258.542016263.052017272.48
End of preview
Want to access all the pages? Upload your documents or become a member.
Related Documents
Statistics For Management (pdf)lg...
|15
|3242
|330
Statistics for Management : PDFlg...
|20
|4443
|300
Inflationary Analysis Using Consumer Price Index and Retail Price Indexlg...
|17
|3322
|335
Statistical Statistics for Management Inflationlg...
|24
|3596
|221
(PDF) Statistics for management | Assignment Samplelg...
|15
|2703
|98
Statics for MANAGEMENT INTRODUCTIONlg...
|20
|4724
|57