(PDF) An introduction to statistical modelling
Added on 2021-05-31
12 Pages2406 Words48 Views
STATISTICALMODELLINGSTUDENT ID:[Pick the date]

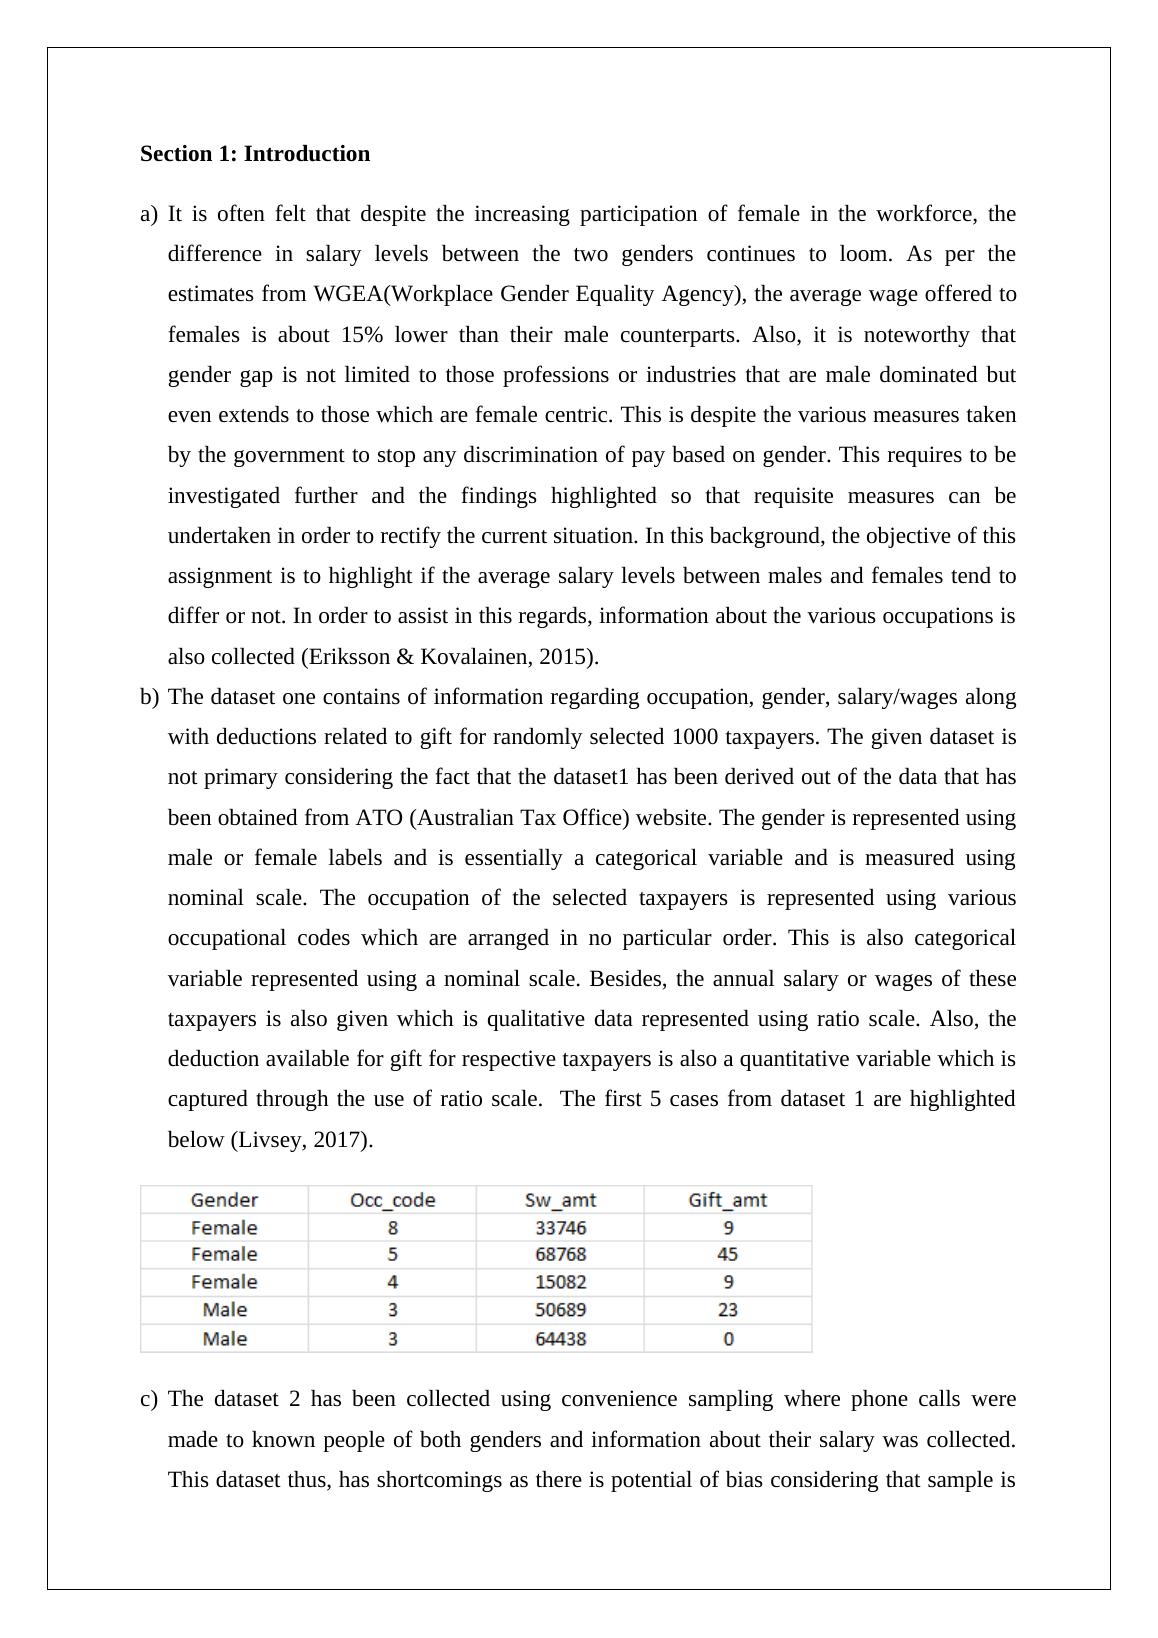
Section 1: Introductiona)It is often felt that despite the increasing participation of female in the workforce, thedifference in salary levels between the two genders continues to loom. As per theestimates from WGEA(Workplace Gender Equality Agency), the average wage offered tofemales is about 15% lower than their male counterparts. Also, it is noteworthy thatgender gap is not limited to those professions or industries that are male dominated buteven extends to those which are female centric. This is despite the various measures takenby the government to stop any discrimination of pay based on gender. This requires to beinvestigated further and the findings highlighted so that requisite measures can beundertaken in order to rectify the current situation. In this background, the objective of thisassignment is to highlight if the average salary levels between males and females tend todiffer or not. In order to assist in this regards, information about the various occupations isalso collected (Eriksson & Kovalainen, 2015). b)The dataset one contains of information regarding occupation, gender, salary/wages alongwith deductions related to gift for randomly selected 1000 taxpayers. The given dataset isnot primary considering the fact that the dataset1 has been derived out of the data that hasbeen obtained from ATO (Australian Tax Office) website. The gender is represented usingmale or female labels and is essentially a categorical variable and is measured usingnominal scale. The occupation of the selected taxpayers is represented using variousoccupational codes which are arranged in no particular order. This is also categoricalvariable represented using a nominal scale. Besides, the annual salary or wages of thesetaxpayers is also given which is qualitative data represented using ratio scale. Also, thededuction available for gift for respective taxpayers is also a quantitative variable which iscaptured through the use of ratio scale. The first 5 cases from dataset 1 are highlightedbelow (Livsey, 2017).c)The dataset 2 has been collected using convenience sampling where phone calls weremade to known people of both genders and information about their salary was collected.This dataset thus, has shortcomings as there is potential of bias considering that sample is
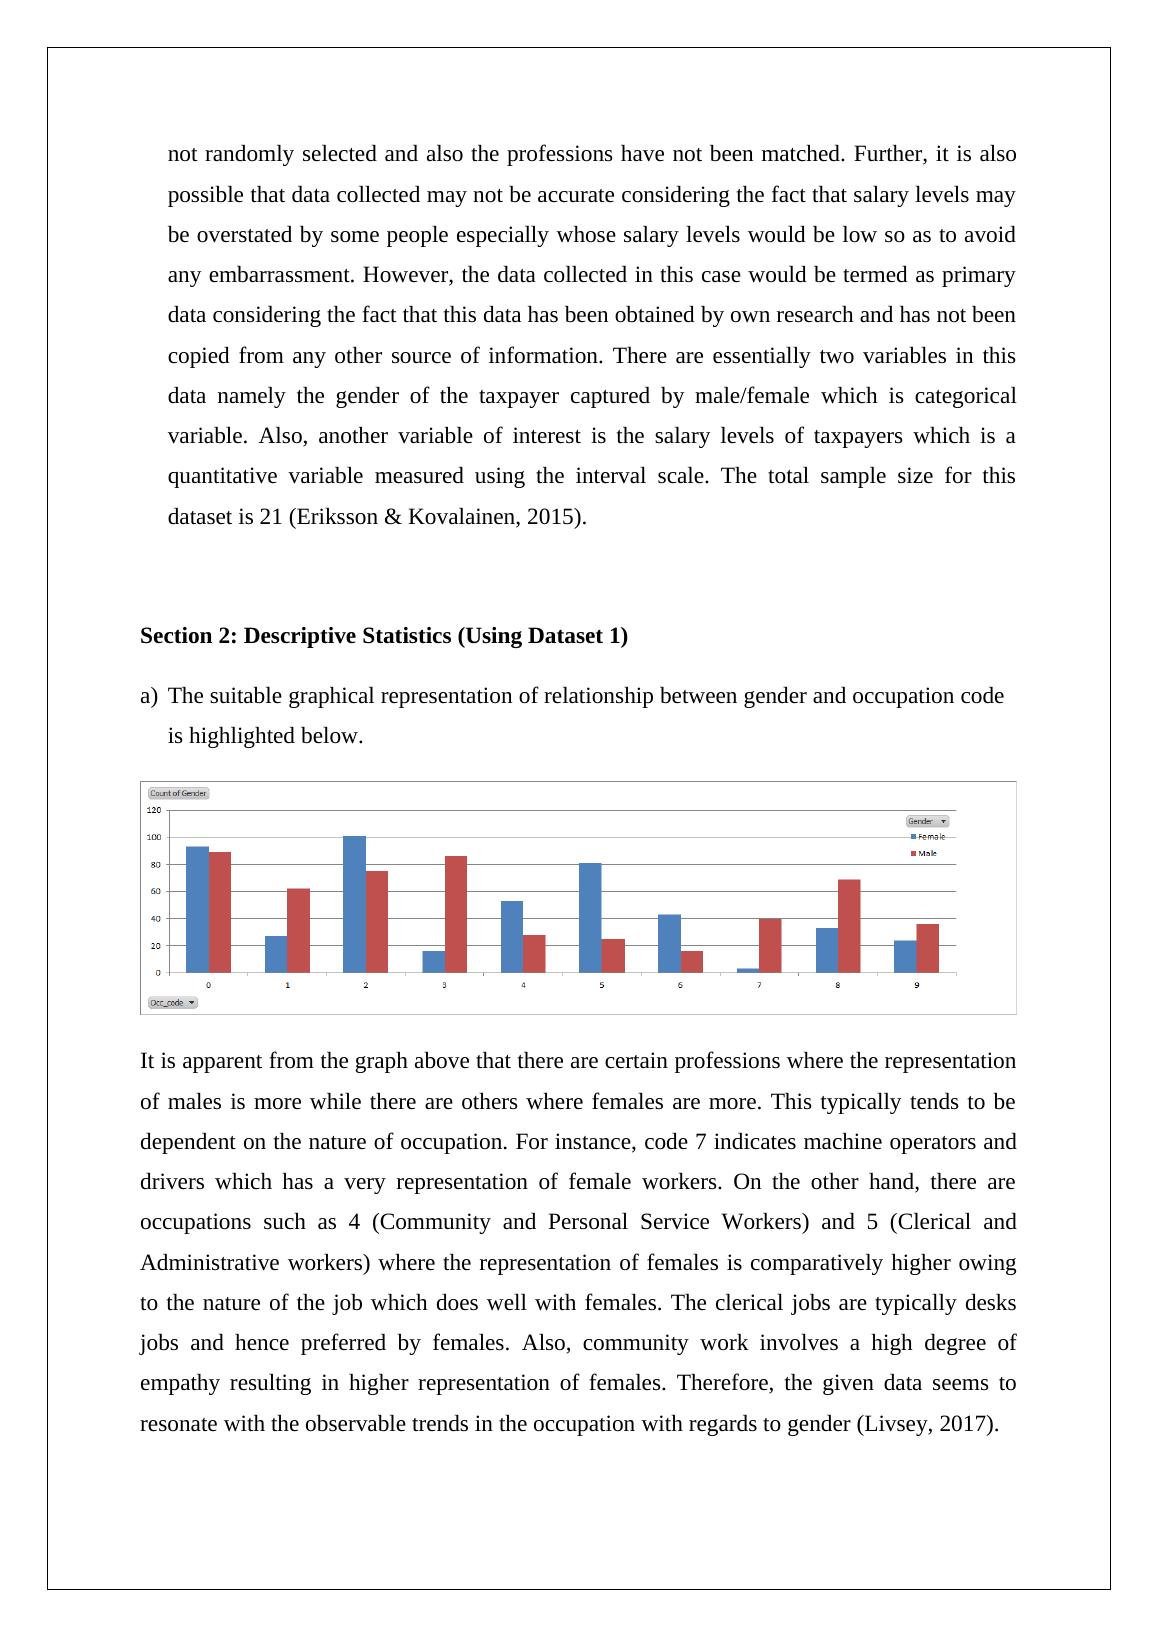
not randomly selected and also the professions have not been matched. Further, it is alsopossible that data collected may not be accurate considering the fact that salary levels maybe overstated by some people especially whose salary levels would be low so as to avoidany embarrassment. However, the data collected in this case would be termed as primarydata considering the fact that this data has been obtained by own research and has not beencopied from any other source of information. There are essentially two variables in thisdata namely the gender of the taxpayer captured by male/female which is categoricalvariable. Also, another variable of interest is the salary levels of taxpayers which is aquantitative variable measured using the interval scale. The total sample size for thisdataset is 21 (Eriksson & Kovalainen, 2015).Section 2: Descriptive Statistics (Using Dataset 1)a)The suitable graphical representation of relationship between gender and occupation code is highlighted below.It is apparent from the graph above that there are certain professions where the representationof males is more while there are others where females are more. This typically tends to bedependent on the nature of occupation. For instance, code 7 indicates machine operators anddrivers which has a very representation of female workers. On the other hand, there areoccupations such as 4 (Community and Personal Service Workers) and 5 (Clerical andAdministrative workers) where the representation of females is comparatively higher owingto the nature of the job which does well with females. The clerical jobs are typically desksjobs and hence preferred by females. Also, community work involves a high degree ofempathy resulting in higher representation of females. Therefore, the given data seems toresonate with the observable trends in the occupation with regards to gender (Livsey, 2017).
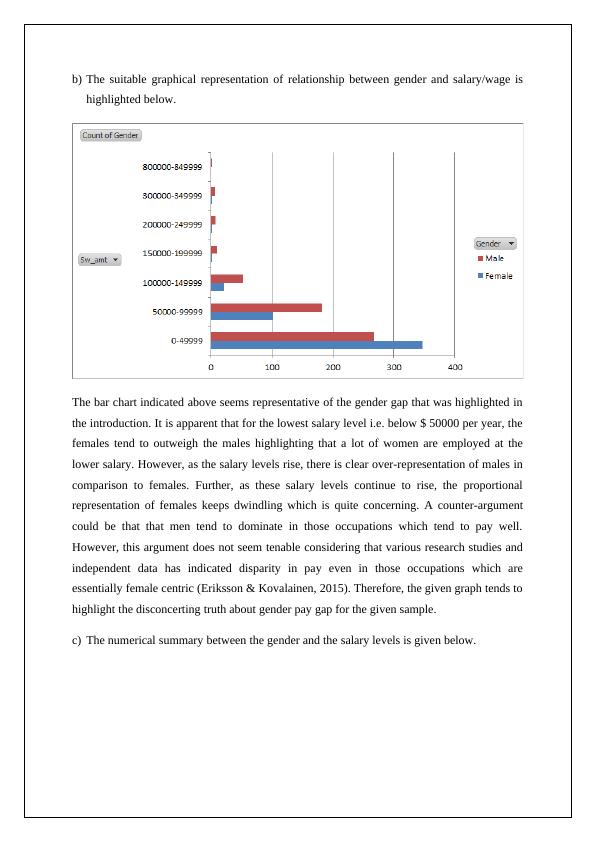
b)The suitable graphical representation of relationship between gender and salary/wage ishighlighted below.The bar chart indicated above seems representative of the gender gap that was highlighted inthe introduction. It is apparent that for the lowest salary level i.e. below $ 50000 per year, thefemales tend to outweigh the males highlighting that a lot of women are employed at thelower salary. However, as the salary levels rise, there is clear over-representation of males incomparison to females. Further, as these salary levels continue to rise, the proportionalrepresentation of females keeps dwindling which is quite concerning. A counter-argumentcould be that that men tend to dominate in those occupations which tend to pay well.However, this argument does not seem tenable considering that various research studies andindependent data has indicated disparity in pay even in those occupations which areessentially female centric (Eriksson & Kovalainen, 2015). Therefore, the given graph tends tohighlight the disconcerting truth about gender pay gap for the given sample.c)The numerical summary between the gender and the salary levels is given below.
End of preview
Want to access all the pages? Upload your documents or become a member.
Related Documents
Statistical Modelling - Assignment PDFlg...
|11
|1983
|83
Gender Gap in Workforce Managementlg...
|10
|1500
|438
Statistical Modelling Assignment PDFlg...
|12
|2377
|37
Statistical Modelling - Assignmentlg...
|11
|2197
|61
Statistical Modelling - Assignment PDFlg...
|11
|2022
|43
Gender Pay Gap in Australia: Statistical Modellinglg...
|11
|2190
|404