Statistical Analysis of S&P, Yahoo, and Google Stock Data
VerifiedAdded on 2020/02/17
|11
|2258
|347
Homework Assignment
AI Summary
This assignment analyzes the stock performance of S&P, Yahoo, and Google using statistical methods. The analysis begins with creating line charts of closing prices and calculating monthly returns for each stock. Summary statistics, including mean, standard deviation, and correlation, are computed to assess risk and return relationships. The assignment explores sampling distributions, probabilities of returns, and likelihood of losses. Furthermore, it delves into creating excess returns and estimating the Capital Asset Pricing Model (CAPM) using linear regression. The interpretation of regression coefficients, R-squared values, and confidence intervals is also provided. The analysis concludes with a confidence interval approach to evaluate stock efficiency. The assignment provides a comprehensive overview of statistical techniques applied to financial data analysis, offering valuable insights into stock market behavior and risk assessment.

STATISTICS
Paraphrase This Document
Need a fresh take? Get an instant paraphrase of this document with our AI Paraphraser
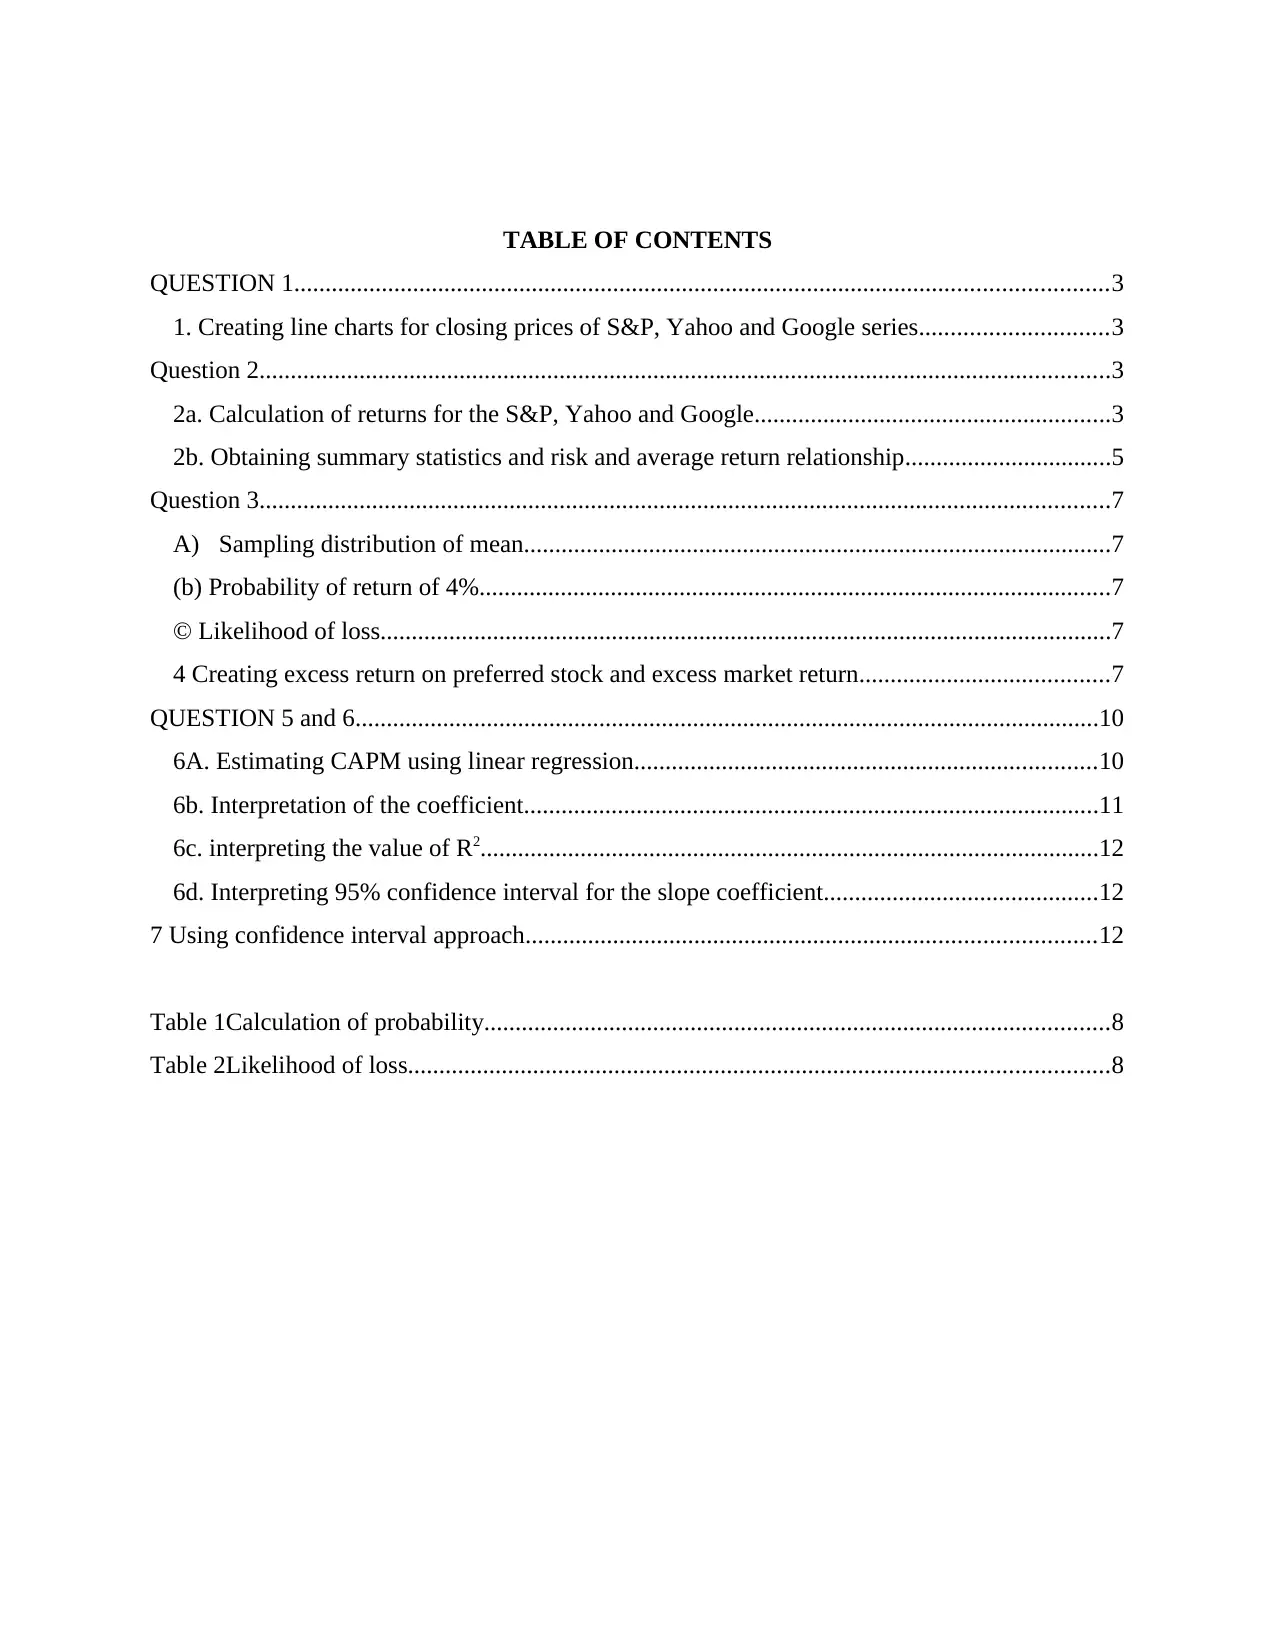
TABLE OF CONTENTS
QUESTION 1..................................................................................................................................3
1. Creating line charts for closing prices of S&P, Yahoo and Google series..............................3
Question 2........................................................................................................................................3
2a. Calculation of returns for the S&P, Yahoo and Google.........................................................3
2b. Obtaining summary statistics and risk and average return relationship.................................5
Question 3........................................................................................................................................7
A) Sampling distribution of mean..............................................................................................7
(b) Probability of return of 4%.....................................................................................................7
© Likelihood of loss.....................................................................................................................7
4 Creating excess return on preferred stock and excess market return........................................7
QUESTION 5 and 6.......................................................................................................................10
6A. Estimating CAPM using linear regression..........................................................................10
6b. Interpretation of the coefficient............................................................................................11
6c. interpreting the value of R2...................................................................................................12
6d. Interpreting 95% confidence interval for the slope coefficient............................................12
7 Using confidence interval approach...........................................................................................12
Table 1Calculation of probability....................................................................................................8
Table 2Likelihood of loss................................................................................................................8
QUESTION 1
1. Creating line charts for closing prices of S&P, Yahoo and Google series
1/1/2012
4/1/2012
7/1/2012
10/1/2012
1/1/2013
4/1/2013
7/1/2013
10/1/2013
1/1/2014
4/1/2014
7/1/2014
10/1/2014
1/1/2015
4/1/2015
7/1/2015
10/1/2015
1/1/2016
4/1/2016
7/1/2016
10/1/2016
1/1/2017
0
500
1000
1500
2000
2500
S& P
Pg
Py
From the presented line chart, it can be seen that S&P’s closing price is highest than
Google and Yahoo’s stock prices. Till the end of 2012, all the three stock’s closing prices shows
a stable trend, afterwards, S&P’s price gone up in 2013 to 1498.11, Google & Yahoo’s price also
goes increase to 755.69 and 19.63 respectively. Following 2013, in 2014, S&P and Yahoo’s
share prices has been increased, however, in contrast, Google share price dropped down. S&P’s
price regularly shows a increasing trend over the duration of 2012 to 2016. Out of all the three
stock, Yahoo’s share price is lowest, on the other side, after decline in 2014, in the next two
years, Google’s share price shows rising trend which is good.
Question 2
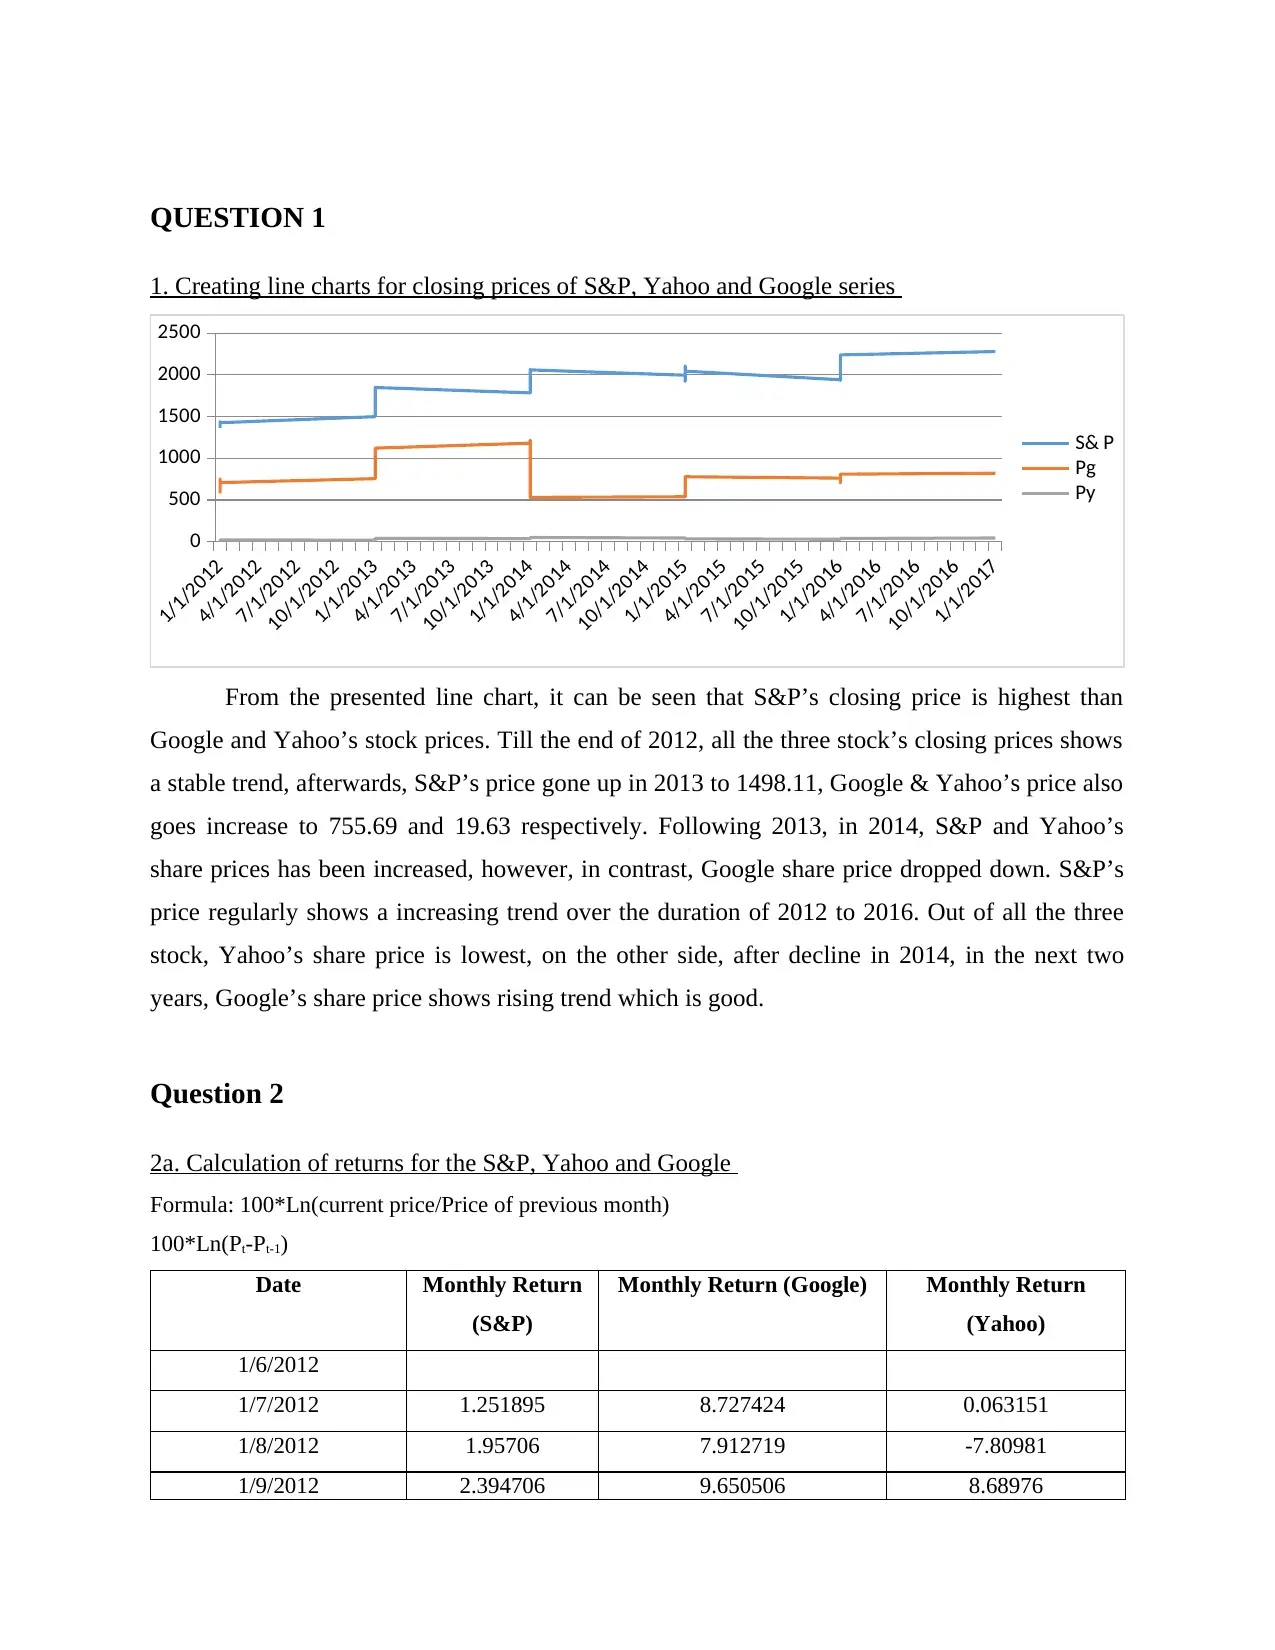
2a. Calculation of returns for the S&P, Yahoo and Google
Formula: 100*Ln(current price/Price of previous month)
100*Ln(Pt-Pt-1)
Date Monthly Return
(S&P)
Monthly Return (Google) Monthly Return
(Yahoo)
1/6/2012
1/7/2012 1.251895 8.727424 0.063151
1/8/2012 1.95706 7.912719 -7.80981
1/9/2012 2.394706 9.650506 8.68976
1. Creating line charts for closing prices of S&P, Yahoo and Google series
1/1/2012
4/1/2012
7/1/2012
10/1/2012
1/1/2013
4/1/2013
7/1/2013
10/1/2013
1/1/2014
4/1/2014
7/1/2014
10/1/2014
1/1/2015
4/1/2015
7/1/2015
10/1/2015
1/1/2016
4/1/2016
7/1/2016
10/1/2016
1/1/2017
0
500
1000
1500
2000
2500
S& P
Pg
Py
From the presented line chart, it can be seen that S&P’s closing price is highest than
Google and Yahoo’s stock prices. Till the end of 2012, all the three stock’s closing prices shows
a stable trend, afterwards, S&P’s price gone up in 2013 to 1498.11, Google & Yahoo’s price also
goes increase to 755.69 and 19.63 respectively. Following 2013, in 2014, S&P and Yahoo’s
share prices has been increased, however, in contrast, Google share price dropped down. S&P’s
price regularly shows a increasing trend over the duration of 2012 to 2016. Out of all the three
stock, Yahoo’s share price is lowest, on the other side, after decline in 2014, in the next two
years, Google’s share price shows rising trend which is good.
Question 2
2a. Calculation of returns for the S&P, Yahoo and Google
Formula: 100*Ln(current price/Price of previous month)
100*Ln(Pt-Pt-1)
Date Monthly Return
(S&P)
Monthly Return (Google) Monthly Return
(Yahoo)
1/6/2012
1/7/2012 1.251895 8.727424 0.063151
1/8/2012 1.95706 7.912719 -7.80981
1/9/2012 2.394706 9.650506 8.68976
⊘ This is a preview!⊘
Do you want full access?
Subscribe today to unlock all pages.
Trusted by 1+ million students worldwide
1/10/2012 -1.99878 -10.3521 5.241907
1/11/2012 0.284266 2.621531 10.85028
1/12/2012 0.704345 1.281881 5.845988
1/1/2013 4.919776 6.606337 -1.36607
1/2/2013 1.099988 5.847923 8.211744
1/3/2013 3.535537 -0.87879 9.909976
1/4/2013 1.792416 3.753931 4.974088
1/5/2013 2.055017 5.503249 6.155186
1/6/2013 -1.5113 1.044786 -4.55066
1/7/2013 4.827776 0.834778 11.13513
1/8/2013 -3.17983 -4.71075 -3.51422
1/9/2013 2.931554 3.368072 20.13744
1/10/2013 4.362998 16.26137 -0.69581
1/11/2013 2.766328 2.776029 11.56895
1/12/2013 2.328951 5.608037 8.944217
1/1/2014 -3.62314 5.237372 -11.6023
1/2/2014 4.221338 2.894278 7.126743
1/3/2014 0.690824 -8.68641 -7.43268
1/4/2014 0.618165 -4.19812 0.139179
1/5/2014 2.08122 -62.5662 -3.68314
1/6/2014 1.887898 2.252067 1.375774
1/7/2014 -1.51947 -0.87956 1.917172
1/8/2014 3.696367 0.483687 7.269076
1/9/2014 -1.56355 1.033517 5.653789
1/10/2014 2.293639 -3.55315 12.22719
1/11/2014 2.423747 -3.36484 11.65034
1/12/2014 -0.41973 -3.41226 -2.40598
1/1/2015 -3.15328 1.290026 -13.8209
1/2/2015 5.343887 4.560044 0.657077
1/3/2015 -1.75491 -1.41948 0.360686
1/4/2015 0.848467 -1.0748 -4.29902
1/5/2015 1.043679 -0.63066 0.865401
Paraphrase This Document
Need a fresh take? Get an instant paraphrase of this document with our AI Paraphraser
1/6/2015 -2.12357 -0.97296 -8.88338
1/7/2015 1.954969 19.68016 -6.90111
1/8/2015 -6.46247 -1.48319 -8.47579
1/9/2015 -2.67987 -1.46948 -15.3014
1/10/2015 7.971934 14.41989 20.87197
1/11/2015 0.050484 3.39445 -5.21507
1/12/2015 -1.76857 1.967796 -1.64011
1/1/2016 -5.20676 -2.16462 -11.9626
1/2/2016 -0.41369 -5.97105 7.442259
1/3/2016 6.390498 6.174433 14.66178
1/4/2016 0.269573 -7.48524 -0.57213
1/5/2016 1.520841 5.626411 3.595772
1/6/2016 0.091043 -6.24282 -1.00663
1/7/2016 3.499044 11.76172 1.663405
1/8/2016 -0.12199 -0.18847 11.27955
1/9/2016 -0.12352 1.783084 0.81538
1/10/2016 -1.96168 0.723689 -3.66255
1/11/2016 3.360347 -4.29129 -1.28378
1/12/2016 1.80371 4.235714 -5.89956
1/1/2017 1.77263 1.318102 13.07152
2b. Obtaining summary statistics and risk and average return relationship
Summary statistics of Google and Yahoo’s monthly return
Google return Yahoo return
Mean 0.629794972 1.861586191
Standard Error 1.409574475 1.109479885
Median 1.281881236 0.815380173
Mode #N/A #N/A
Standard Deviation 10.45368409 8.228123045
Sample Variance 109.279511 67.70200884
Kurtosis 24.98016236 -0.344618753
Skewness -4.015978724 0.110839548
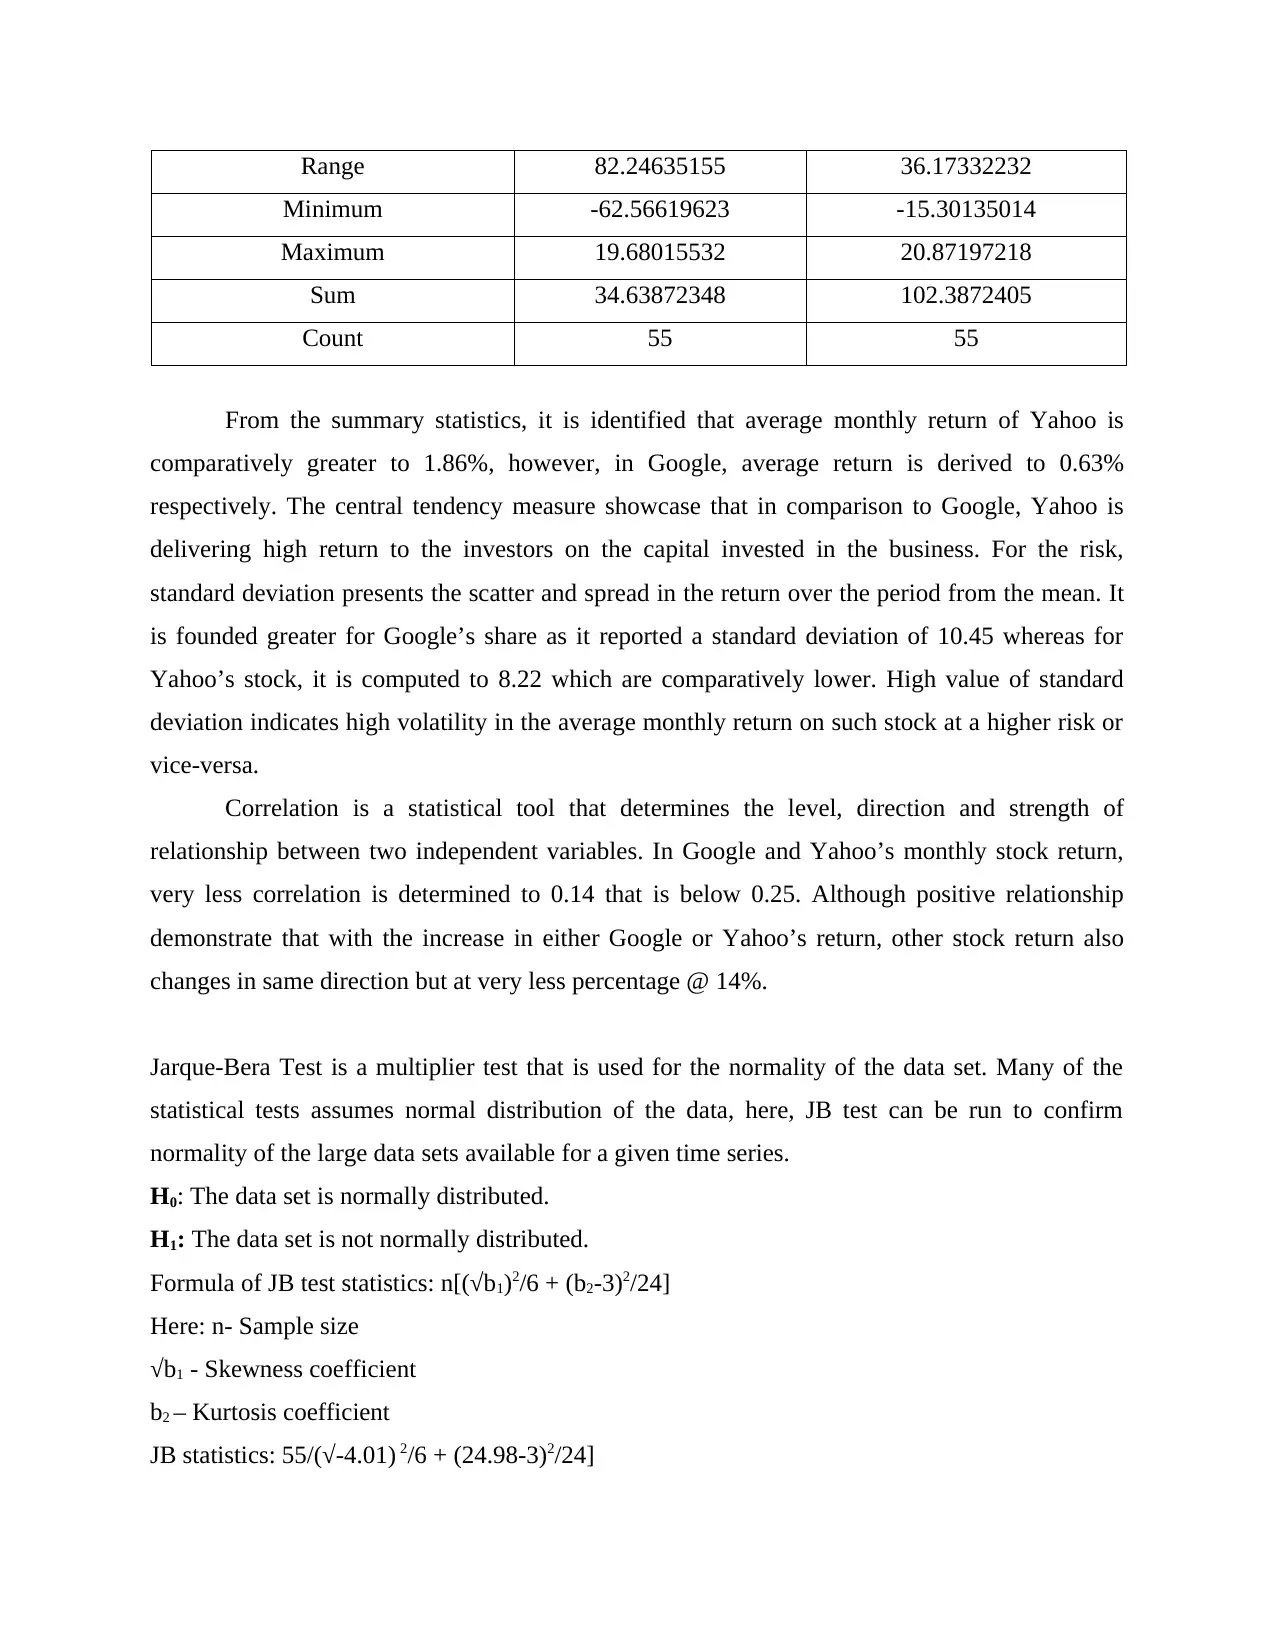
Range 82.24635155 36.17332232
Minimum -62.56619623 -15.30135014
Maximum 19.68015532 20.87197218
Sum 34.63872348 102.3872405
Count 55 55
From the summary statistics, it is identified that average monthly return of Yahoo is
comparatively greater to 1.86%, however, in Google, average return is derived to 0.63%
respectively. The central tendency measure showcase that in comparison to Google, Yahoo is
delivering high return to the investors on the capital invested in the business. For the risk,
standard deviation presents the scatter and spread in the return over the period from the mean. It
is founded greater for Google’s share as it reported a standard deviation of 10.45 whereas for
Yahoo’s stock, it is computed to 8.22 which are comparatively lower. High value of standard
deviation indicates high volatility in the average monthly return on such stock at a higher risk or
vice-versa.
Correlation is a statistical tool that determines the level, direction and strength of
relationship between two independent variables. In Google and Yahoo’s monthly stock return,
very less correlation is determined to 0.14 that is below 0.25. Although positive relationship
demonstrate that with the increase in either Google or Yahoo’s return, other stock return also
changes in same direction but at very less percentage @ 14%.
Jarque-Bera Test is a multiplier test that is used for the normality of the data set. Many of the
statistical tests assumes normal distribution of the data, here, JB test can be run to confirm
normality of the large data sets available for a given time series.
H0: The data set is normally distributed.
H1: The data set is not normally distributed.
Formula of JB test statistics: n[(√b1)2/6 + (b2-3)2/24]
Here: n- Sample size
√b1 - Skewness coefficient
b2 – Kurtosis coefficient
JB statistics: 55/(√-4.01) 2/6 + (24.98-3)2/24]
⊘ This is a preview!⊘
Do you want full access?
Subscribe today to unlock all pages.
Trusted by 1+ million students worldwide
55/(√-4.01) 2/6 + (24.98-3)2/24]
Question 3
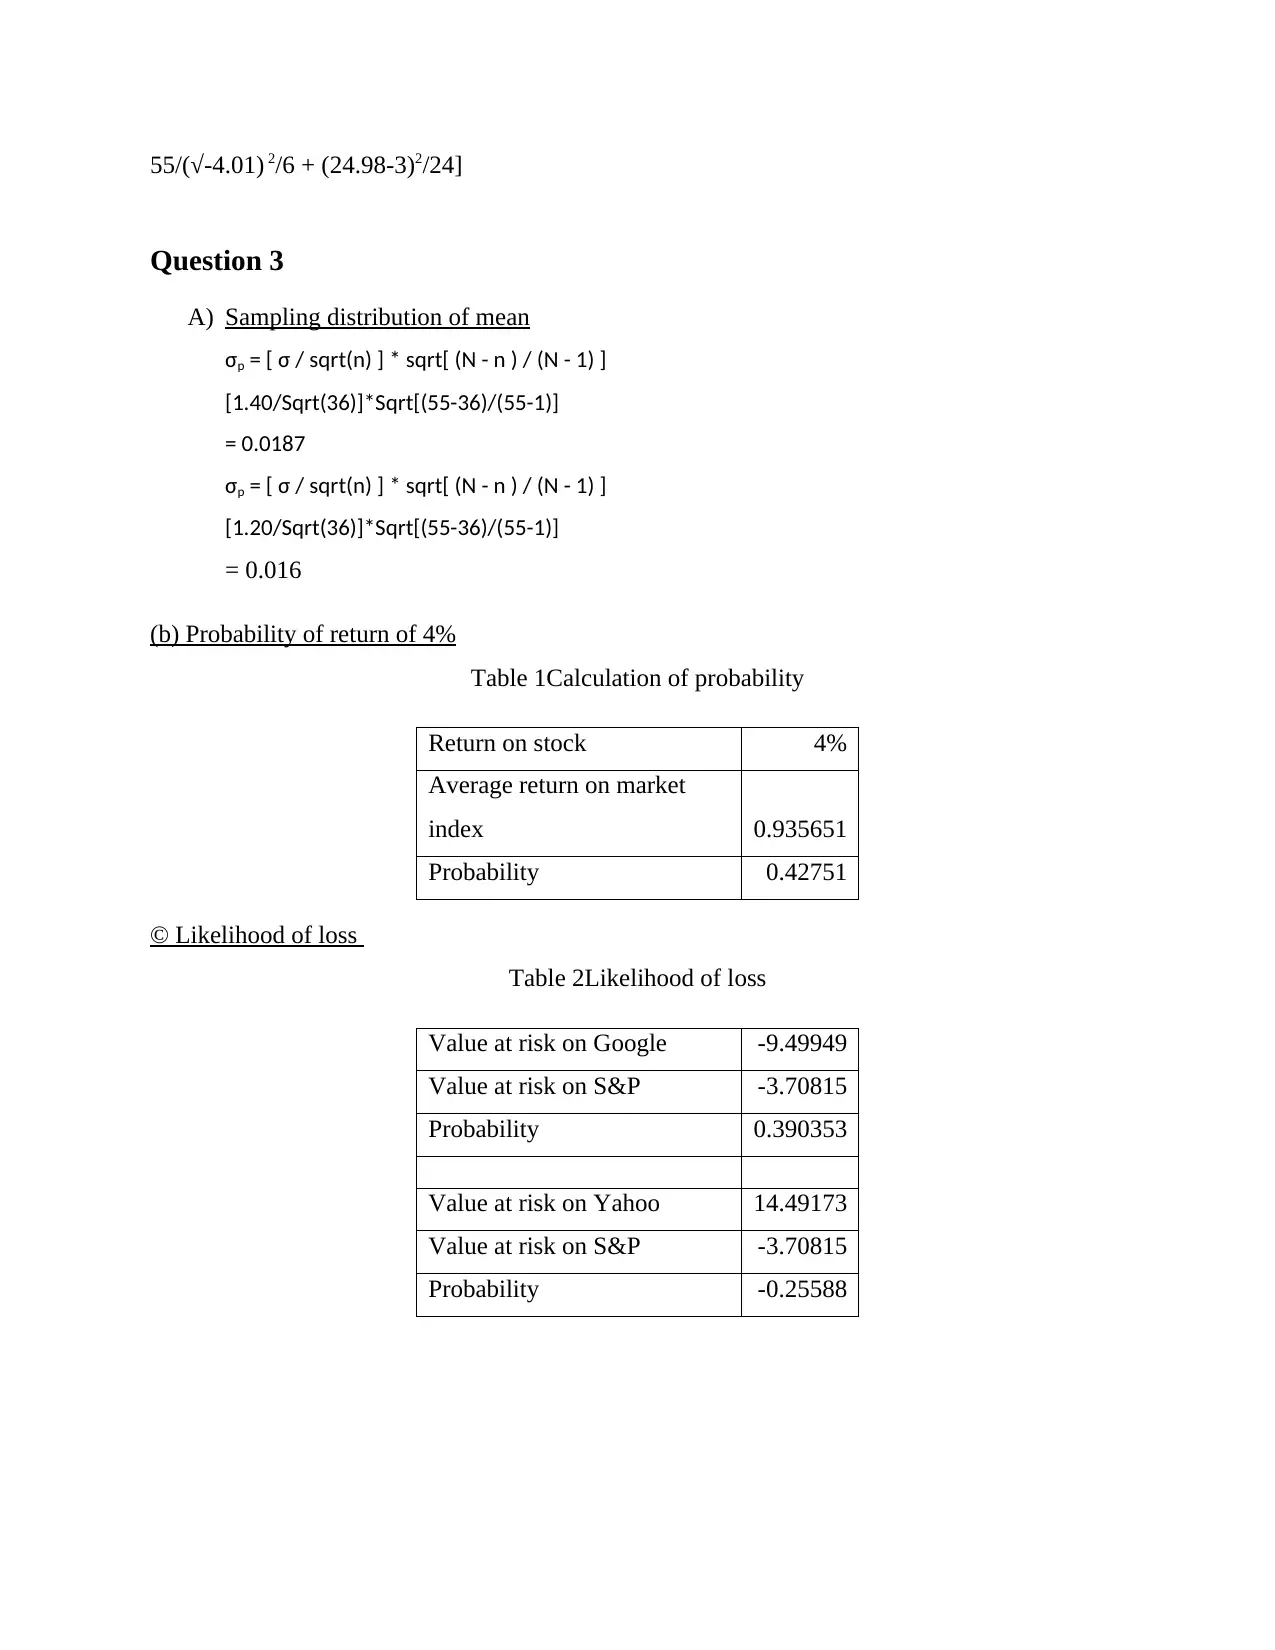
A) Sampling distribution of mean
σp = [ σ / sqrt(n) ] * sqrt[ (N - n ) / (N - 1) ]
[1.40/Sqrt(36)]*Sqrt[(55-36)/(55-1)]
= 0.0187
σp = [ σ / sqrt(n) ] * sqrt[ (N - n ) / (N - 1) ]
[1.20/Sqrt(36)]*Sqrt[(55-36)/(55-1)]
= 0.016
(b) Probability of return of 4%
Table 1Calculation of probability
Return on stock 4%
Average return on market
index 0.935651
Probability 0.42751
© Likelihood of loss
Table 2Likelihood of loss
Value at risk on Google -9.49949
Value at risk on S&P -3.70815
Probability 0.390353
Value at risk on Yahoo 14.49173
Value at risk on S&P -3.70815
Probability -0.25588
Question 3
A) Sampling distribution of mean
σp = [ σ / sqrt(n) ] * sqrt[ (N - n ) / (N - 1) ]
[1.40/Sqrt(36)]*Sqrt[(55-36)/(55-1)]
= 0.0187
σp = [ σ / sqrt(n) ] * sqrt[ (N - n ) / (N - 1) ]
[1.20/Sqrt(36)]*Sqrt[(55-36)/(55-1)]
= 0.016
(b) Probability of return of 4%
Table 1Calculation of probability
Return on stock 4%
Average return on market
index 0.935651
Probability 0.42751
© Likelihood of loss
Table 2Likelihood of loss
Value at risk on Google -9.49949
Value at risk on S&P -3.70815
Probability 0.390353
Value at risk on Yahoo 14.49173
Value at risk on S&P -3.70815
Probability -0.25588
Paraphrase This Document
Need a fresh take? Get an instant paraphrase of this document with our AI Paraphraser
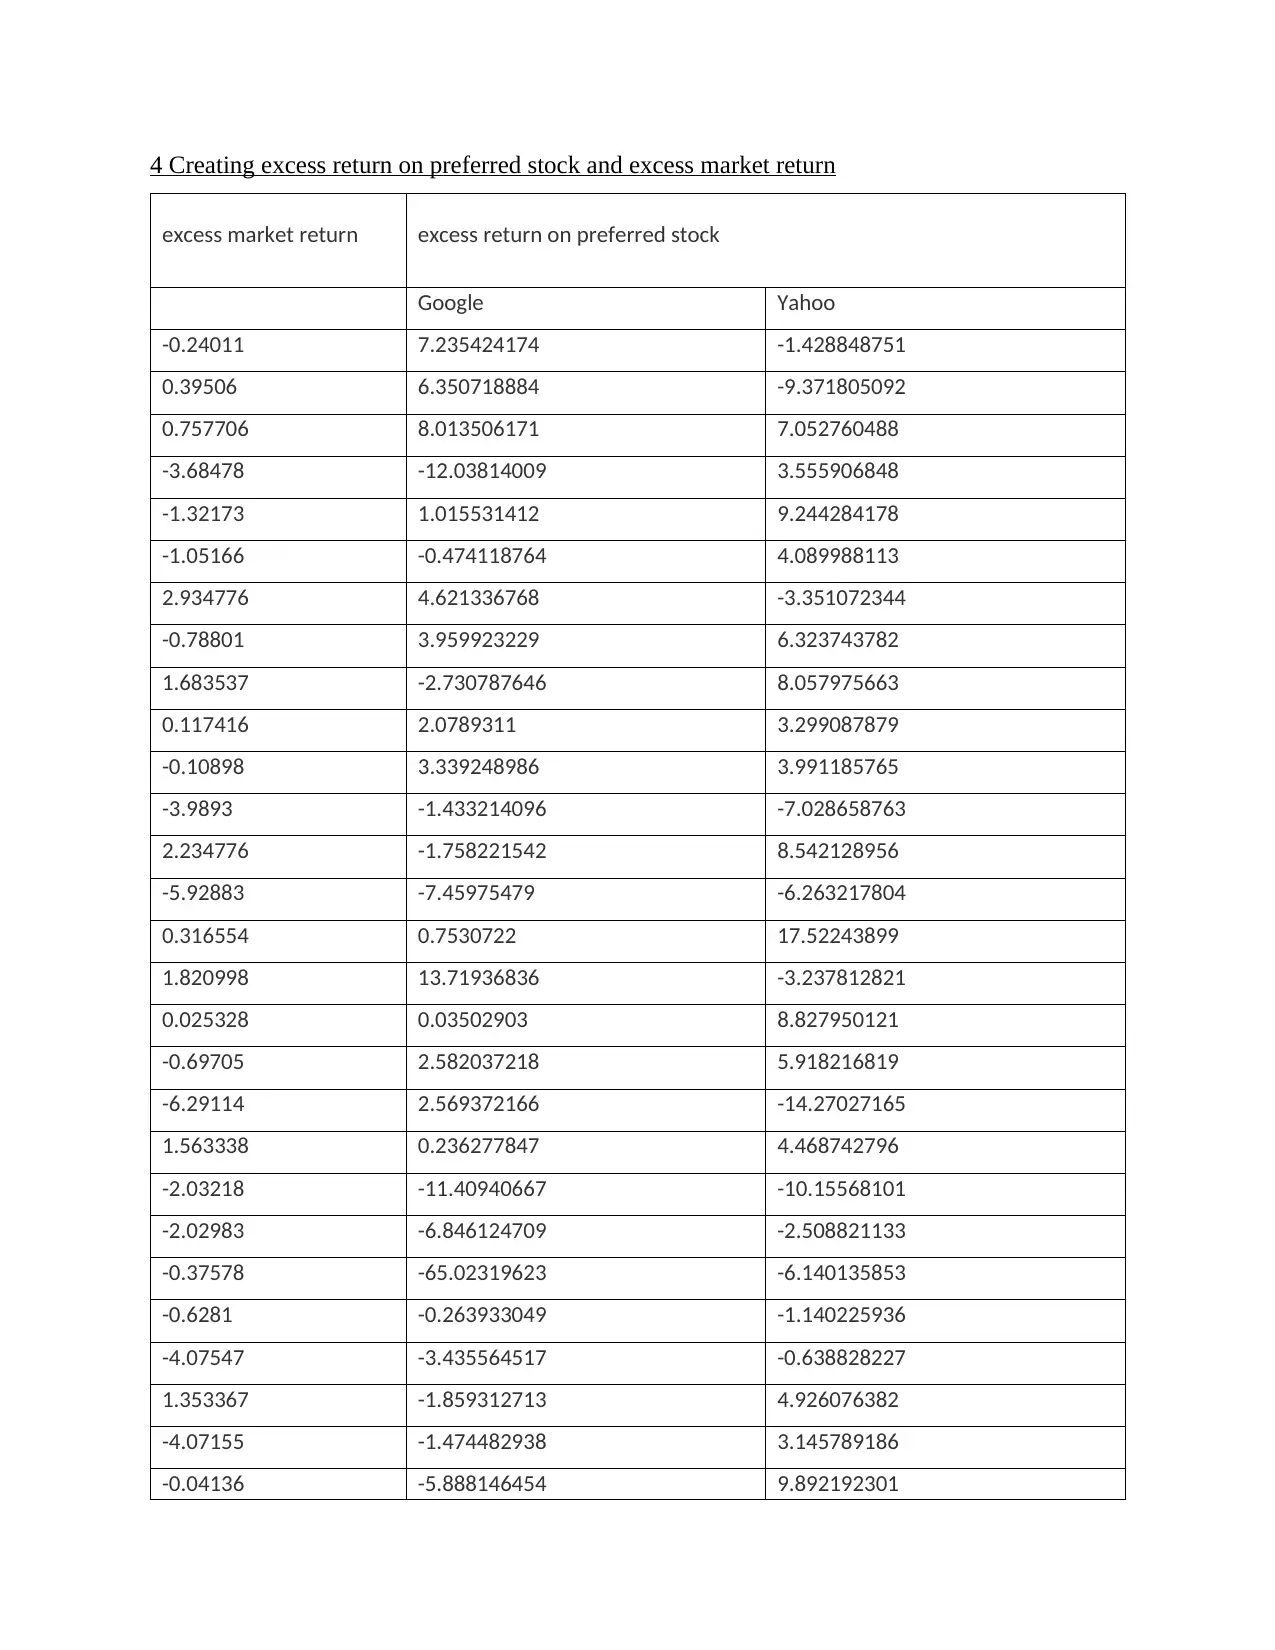
4 Creating excess return on preferred stock and excess market return
excess market return excess return on preferred stock
Google Yahoo
-0.24011 7.235424174 -1.428848751
0.39506 6.350718884 -9.371805092
0.757706 8.013506171 7.052760488
-3.68478 -12.03814009 3.555906848
-1.32173 1.015531412 9.244284178
-1.05166 -0.474118764 4.089988113
2.934776 4.621336768 -3.351072344
-0.78801 3.959923229 6.323743782
1.683537 -2.730787646 8.057975663
0.117416 2.0789311 3.299087879
-0.10898 3.339248986 3.991185765
-3.9893 -1.433214096 -7.028658763
2.234776 -1.758221542 8.542128956
-5.92883 -7.45975479 -6.263217804
0.316554 0.7530722 17.52243899
1.820998 13.71936836 -3.237812821
0.025328 0.03502903 8.827950121
-0.69705 2.582037218 5.918216819
-6.29114 2.569372166 -14.27027165
1.563338 0.236277847 4.468742796
-2.03218 -11.40940667 -10.15568101
-2.02983 -6.846124709 -2.508821133
-0.37578 -65.02319623 -6.140135853
-0.6281 -0.263933049 -1.140225936
-4.07547 -3.435564517 -0.638828227
1.353367 -1.859312713 4.926076382
-4.07155 -1.474482938 3.145789186
-0.04136 -5.888146454 9.892192301
0.229747 -5.55883689 9.456341406
-2.58973 -5.582263554 -4.575984028
-4.82828 -0.384973591 -15.49590011
3.341887 2.558043956 -1.344922752
-3.68891 -3.353479143 -1.573314307
-1.19753 -3.120801687 -6.345018493
-1.05132 -2.725663188 -1.229598739
-4.45857 -3.307956743 -11.21837589
-0.25003 17.47515532 -9.106105149
-8.66247 -3.683188406 -10.67579247
-4.73987 -3.529482744 -17.36135014
5.820934 12.2688872 18.72097218
-2.16752 1.176449501 -7.433066114
-4.03757 -0.301204199 -3.909114296
-7.13776 -4.095620428 -13.89362848
-2.15369 -7.711054572 5.702258597
4.604498 4.388433353 12.87577725
-1.54943 -9.304237329 -2.391130698
-0.31316 3.792410864 1.76177241
-1.39696 -7.730817687 -2.494631017
2.041044 10.30371915 0.20540469
-1.68999 -1.756465705 9.711549415
-1.73152 0.175083925 -0.792619827
-3.79568 -1.110311001 -5.496547581
0.992347 -6.65929142 -3.651776866
-0.67529 1.756713564 -8.378564703
-0.67837 -1.132898395 10.62051732
After the analyzing the existing position of both the stocks such as Google as well as
Yahoo stocks are properly evaluated by applying this particular technique in or order to
determine their current position in the external business market. In terms of volume of both the
⊘ This is a preview!⊘
Do you want full access?
Subscribe today to unlock all pages.
Trusted by 1+ million students worldwide
stocks of Google and Yahoo, Google has higher volume size as compared to yahoo which is the
main reason behind the increasing higher market risks as higher the share market higher will be
its overall business risks. Excess return on preferred stock and excess market return of Google is
higher in volume that increases overall risk of an entity which will directly affected all the
shareholders who have invested in the business. The return of Google is decreasing on a constant
basis as compared to the price of Yahoo which is increasing with the passage of time. Volume
size of Yahoo is less that safeguards its entity from the external market changes in terms of risks
incurred on the firm. The share value of Yahoo increases due to higher efforts applied by the
entity owner on improving its existing business performance along with the considerations of
each and every factors considered by the business in order to maintain their survival in the
external environment as costs and risks are eliminated by the firm by focuses on its strength and
the capabilities.
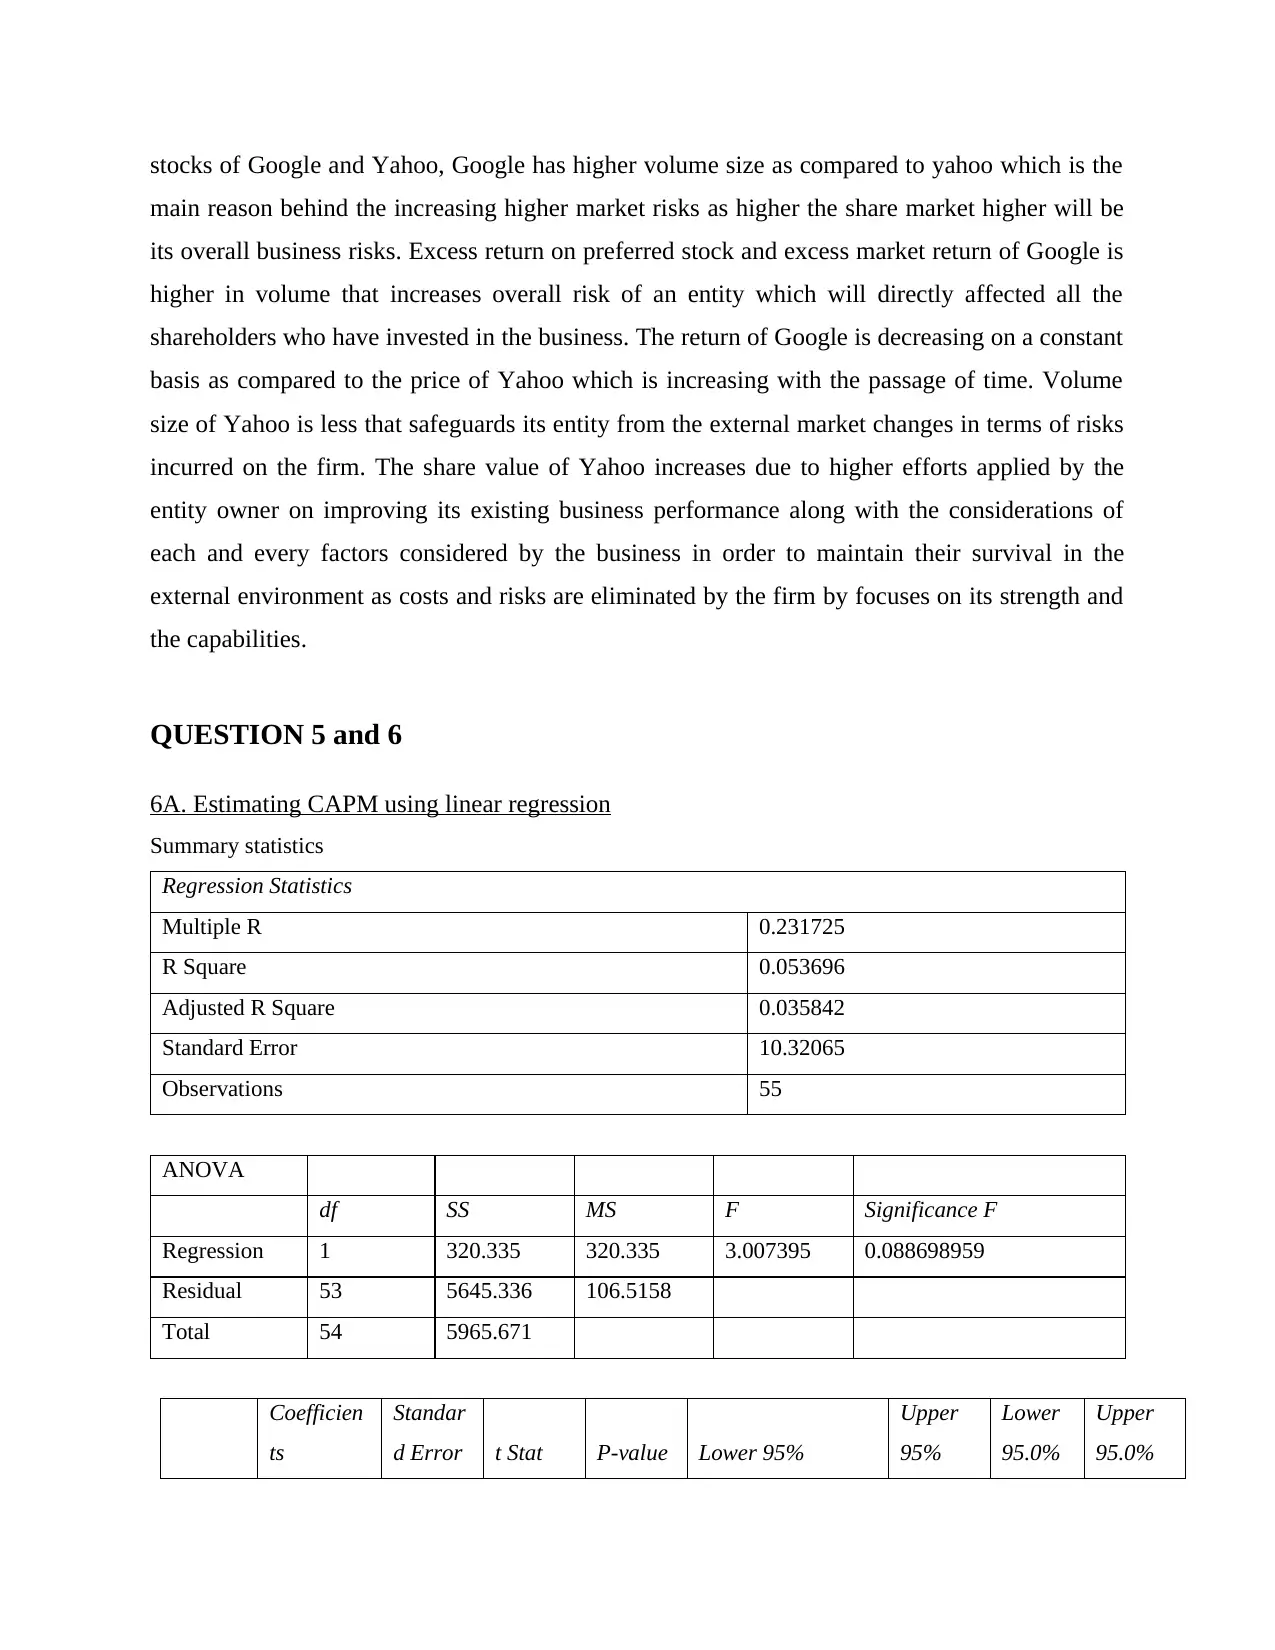
QUESTION 5 and 6
6A. Estimating CAPM using linear regression
Summary statistics
Regression Statistics
Multiple R 0.231725
R Square 0.053696
Adjusted R Square 0.035842
Standard Error 10.32065
Observations 55
ANOVA
df SS MS F Significance F
Regression 1 320.335 320.335 3.007395 0.088698959
Residual 53 5645.336 106.5158
Total 54 5965.671
Coefficien
ts
Standar
d Error t Stat P-value Lower 95%
Upper
95%
Lower
95.0%
Upper
95.0%
main reason behind the increasing higher market risks as higher the share market higher will be
its overall business risks. Excess return on preferred stock and excess market return of Google is
higher in volume that increases overall risk of an entity which will directly affected all the
shareholders who have invested in the business. The return of Google is decreasing on a constant
basis as compared to the price of Yahoo which is increasing with the passage of time. Volume
size of Yahoo is less that safeguards its entity from the external market changes in terms of risks
incurred on the firm. The share value of Yahoo increases due to higher efforts applied by the
entity owner on improving its existing business performance along with the considerations of
each and every factors considered by the business in order to maintain their survival in the
external environment as costs and risks are eliminated by the firm by focuses on its strength and
the capabilities.
QUESTION 5 and 6
6A. Estimating CAPM using linear regression
Summary statistics
Regression Statistics
Multiple R 0.231725
R Square 0.053696
Adjusted R Square 0.035842
Standard Error 10.32065
Observations 55
ANOVA
df SS MS F Significance F
Regression 1 320.335 320.335 3.007395 0.088698959
Residual 53 5645.336 106.5158
Total 54 5965.671
Coefficien
ts
Standar
d Error t Stat P-value Lower 95%
Upper
95%
Lower
95.0%
Upper
95.0%
Paraphrase This Document
Need a fresh take? Get an instant paraphrase of this document with our AI Paraphraser
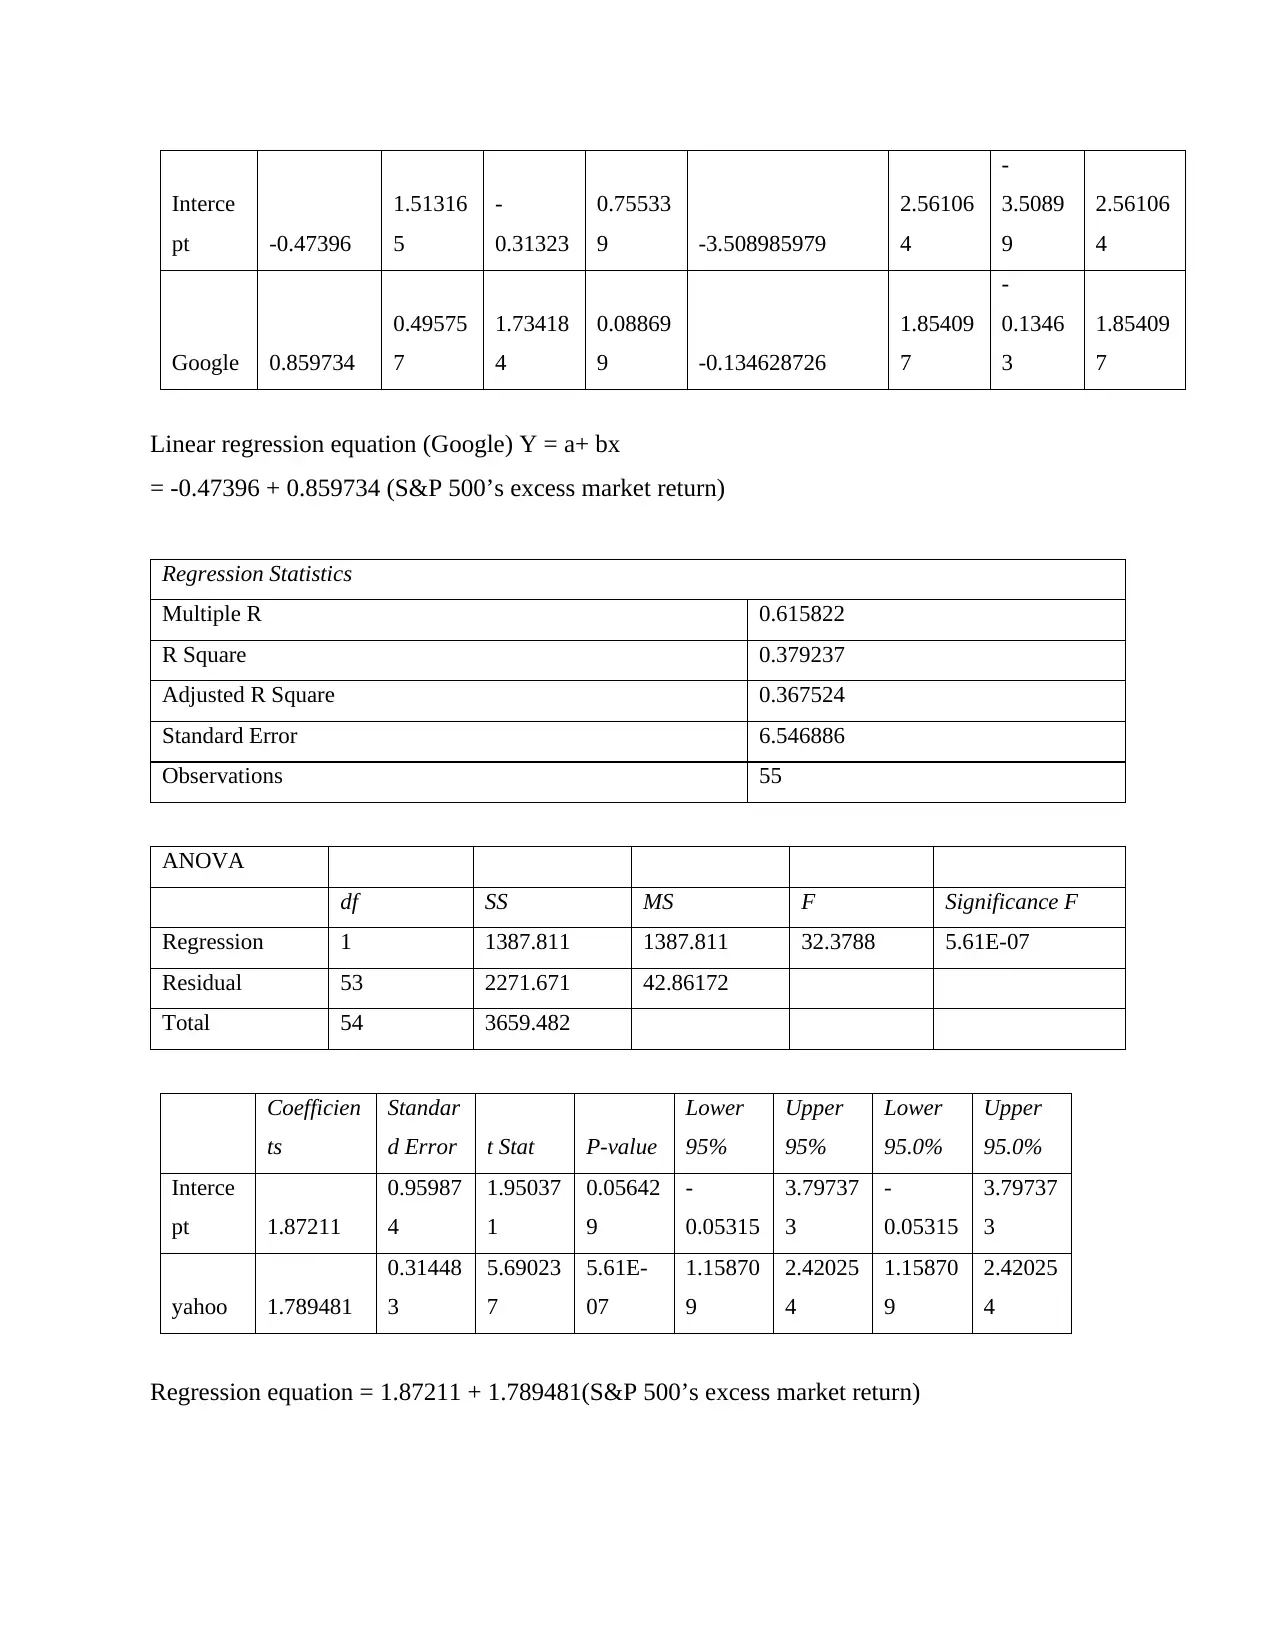
Interce
pt -0.47396
1.51316
5
-
0.31323
0.75533
9 -3.508985979
2.56106
4
-
3.5089
9
2.56106
4
Google 0.859734
0.49575
7
1.73418
4
0.08869
9 -0.134628726
1.85409
7
-
0.1346
3
1.85409
7
Linear regression equation (Google) Y = a+ bx
= -0.47396 + 0.859734 (S&P 500’s excess market return)
Regression Statistics
Multiple R 0.615822
R Square 0.379237
Adjusted R Square 0.367524
Standard Error 6.546886
Observations 55
ANOVA
df SS MS F Significance F
Regression 1 1387.811 1387.811 32.3788 5.61E-07
Residual 53 2271.671 42.86172
Total 54 3659.482
Coefficien
ts
Standar
d Error t Stat P-value
Lower
95%
Upper
95%
Lower
95.0%
Upper
95.0%
Interce
pt 1.87211
0.95987
4
1.95037
1
0.05642
9
-
0.05315
3.79737
3
-
0.05315
3.79737
3
yahoo 1.789481
0.31448
3
5.69023
7
5.61E-
07
1.15870
9
2.42025
4
1.15870
9
2.42025
4
Regression equation = 1.87211 + 1.789481(S&P 500’s excess market return)
1 out of 11
Related Documents


Your All-in-One AI-Powered Toolkit for Academic Success.
+13062052269
info@desklib.com
Available 24*7 on WhatsApp / Email
![[object Object]](/_next/static/media/star-bottom.7253800d.svg)
Unlock your academic potential
Copyright © 2020–2026 A2Z Services. All Rights Reserved. Developed and managed by ZUCOL.