Statistics For Management TABLE OF CONTENTS INTRODUCTION 1 TASK 11 A) Hypothesis testing on income of employees in public sector 3 D) Annual growth rate 3 TASK 24 2.1 Presenting pictorial form of data
Added on 2020-06-06
20 Pages3380 Words304 Views
Statistics For management
TABLE OF CONTENTS
INTRODUCTION...........................................................................................................................1
TASK 1............................................................................................................................................1
A) Hypothesis testing on income of employees in public sector...........................................1
B) Producing T test on income of workers in private entities...............................................2
C) Enumerating Earnings–Time chart based on income level...............................................3
D) Annual growth rate...........................................................................................................3
TASK 2............................................................................................................................................4
2.1 Presenting pictorial form of data......................................................................................4
2.2 Presenting data analysis....................................................................................................5
B) Explaining measures of dispersion....................................................................................7
2.3 Presentation of report to director of School.....................................................................7
SECTION B.....................................................................................................................................8
2.4 Line chart..........................................................................................................................8
..........................................................................................................................................................9
..........................................................................................................................................................9
..........................................................................................................................................................9
TASK 3..........................................................................................................................................10
A) Calculating deliveries made in each trips........................................................................10
B) Presenting computation of deliveries..............................................................................10
C) Discussing EOQ..............................................................................................................10
TASK 4..........................................................................................................................................12
4.1 Data analysis...................................................................................................................12
........................................................................................................................................................14
........................................................................................................................................................14
4.2 Determining relationship between prices and bedrooms................................................15
CONCLUSION..............................................................................................................................16
REFERENCES..............................................................................................................................17
INTRODUCTION
Statistics is quite useful tool used by management and statisticians for collecting
necessary information to draw out concrete solutions. The present report deals with importance
of statistics for management to draw effective conclusions by posing several problems. It also
discusses how income level of men and women in private and public sector differs from each
other. Moreover, it also explains importance of mean, mode and standard deviation for analysing
marks scored by students of KCB School. Measures of dispersion is also enumerated quite
effectively. The report also highlights benefits of using EOQ model for purchasing stock in
desired quantity and also number of bedrooms and prices is also discussed assessing how prices
changes. Thus, statistical tools are effective and meaningful to management to interpret
information in the best possible way.
TASK 1
A) Hypothesis testing on income of employees in public sector
Null hypothesis is carried out to assess variations in income level.
H 0 - No difference between income level of male and female
H 1 - Significant difference between income level of male and female in public sector
Illustration 1: Computation of T- test
Interpretation-
For analysing difference between variations in income level of male and female in public
industry, T-test is being calculated. The range of value of level of significance is 1.27 > 0.05 and
this highlights that there is not much difference between income level of both male and female
1
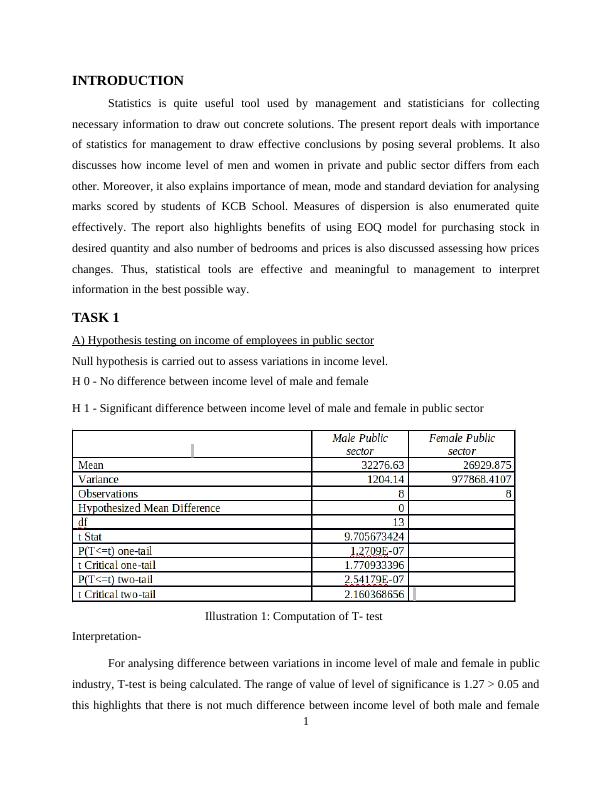
workers. This is conveyed by calculations that income of men is 32276 while of women is 26929
which shows little variations or difference between them and with little difference, men is ahead.
This means that no gender biasness is prevailing in public sector and government is promoting
women quite effectively with men as well. T- test is drawn which shows that difference between
value of variance and that of mean. The table shows that no such difference is observed in
income level of men and women.
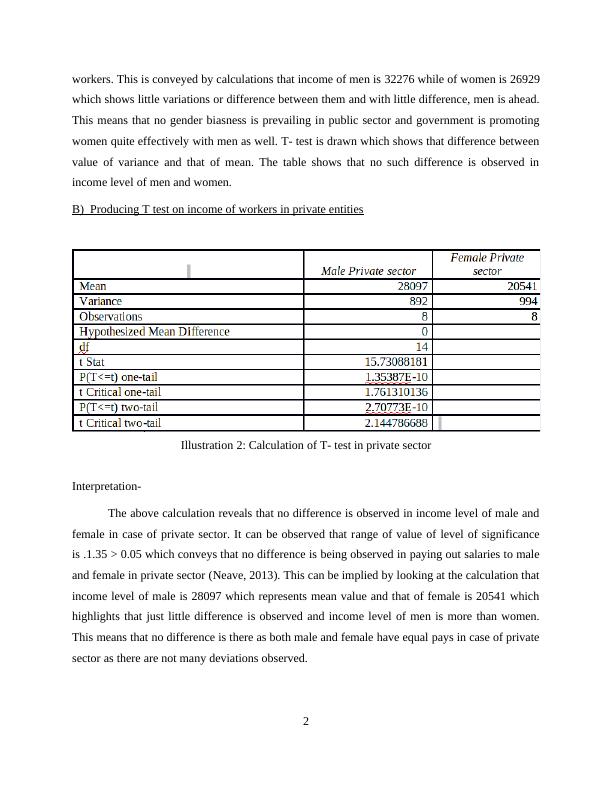
B) Producing T test on income of workers in private entities
Illustration 2: Calculation of T- test in private sector
Interpretation-
The above calculation reveals that no difference is observed in income level of male and
female in case of private sector. It can be observed that range of value of level of significance
is .1.35 > 0.05 which conveys that no difference is being observed in paying out salaries to male
and female in private sector (Neave, 2013). This can be implied by looking at the calculation that
income level of male is 28097 which represents mean value and that of female is 20541 which
highlights that just little difference is observed and income level of men is more than women.
This means that no difference is there as both male and female have equal pays in case of private
sector as there are not many deviations observed.
2
which shows little variations or difference between them and with little difference, men is ahead.
This means that no gender biasness is prevailing in public sector and government is promoting
women quite effectively with men as well. T- test is drawn which shows that difference between
value of variance and that of mean. The table shows that no such difference is observed in
income level of men and women.
B) Producing T test on income of workers in private entities
Illustration 2: Calculation of T- test in private sector
Interpretation-
The above calculation reveals that no difference is observed in income level of male and
female in case of private sector. It can be observed that range of value of level of significance
is .1.35 > 0.05 which conveys that no difference is being observed in paying out salaries to male
and female in private sector (Neave, 2013). This can be implied by looking at the calculation that
income level of male is 28097 which represents mean value and that of female is 20541 which
highlights that just little difference is observed and income level of men is more than women.
This means that no difference is there as both male and female have equal pays in case of private
sector as there are not many deviations observed.
2
End of preview
Want to access all the pages? Upload your documents or become a member.
Related Documents
Assignment on Statistics PDFlg...
|20
|3514
|85
Statistics for Management Assignment Reportlg...
|23
|5182
|42
Statistics for Management : Assignmentlg...
|22
|5114
|86
Assignment Statistics for Managementlg...
|22
|4725
|101
Statistics for Management Researchlg...
|20
|4601
|57
Statistics for Management Assignment - Doclg...
|19
|2770
|417