Statistics for Management Assignment Report
Added on 2020-07-22
23 Pages5182 Words42 Views
Statistics for Management

TABLE OF CONTENTS
INTRODUCTION...........................................................................................................................1
TASK 1............................................................................................................................................1
A) Hypothesis testing on income of employees in public industry........................................1
B) Producing T test based on income level of male and female in the private sectors..........2
C) Producing Earnings – Time chart for male and female in private as well as public sector3
D) Annual growth rate............................................................................................................4
TASK 2............................................................................................................................................6
2.1 Pictorial presentation of data............................................................................................6
2.2 Data analysis.....................................................................................................................7
B) Discussing measures of dispersion....................................................................................9
2.3 Producing report and interpretation of measures of central tendencies...........................9
SECTION B...................................................................................................................................10
2.4 Preparing Best fit line chart............................................................................................10
TASK 3..........................................................................................................................................12
A) Producing deliveries made in a particular period............................................................12
B) Presenting number of deliveries accomplish in various rounds......................................13
C) Finding the economic order quantity using precise statistical formula..........................14
TASK 4..........................................................................................................................................15
4.1 Data Analysis..................................................................................................................15
4.2 Relationship between number of bedrooms and their prices in varied streets...............18
CONCLUSION..............................................................................................................................19
REFERENCES..............................................................................................................................20
INTRODUCTION
Statistics is useful as it shows relationship between dependent and independent variables
to arrive at meaningful conclusions. It is quite useful technique for statistician to draw concrete
results in the best possible way. The enclosed reports deals with statistics for management and
provides useful techniques of statistics to be used by the management to arrive at results quite
easily. This report discusses testing of hypothesis to show difference between two variables and
also computations of mean, mode and standard deviation is also done. EOQ model is also
discussed so that overall cost may be reduced while purchasing stock by the organisation.
Moreover, correlation method and chi square technique are also discussed being used by
statistician for arriving at valid conclusions with much ease. These statistics techniques and
methods are quite useful for managers to arrive at concrete results and resolve the problem quite
effectively and take better and enhanced decisions.
TASK 1
A) Hypothesis testing on income of employees in public industry
The ranges of hypothesis testing are as follows-
H 0 : No significant difference between income level of men in public sector and income level of
women in public entities.
H 1 : Significant difference observed between income level of men in public entities and income
level of women in public entities
Table – 1 T test table showing difference of income level of male and female in public entities
Men Public
Entities
Women Public
Entities
Value of mean calculated 32276.625 26929.875
Value of variance calculated 1449962.268 977868.4107
Observations drawn from sector 8 8
Hypothesized Mean showing difference 0
df 13
t Stat 9.705673424
P(T<=t) one-tail 1.27E-007
t Critical one-tail 1.770933396
P(T<=t) two-tail 2.54E-007
t Critical two-tail 2.160368656
Interpretation -
1
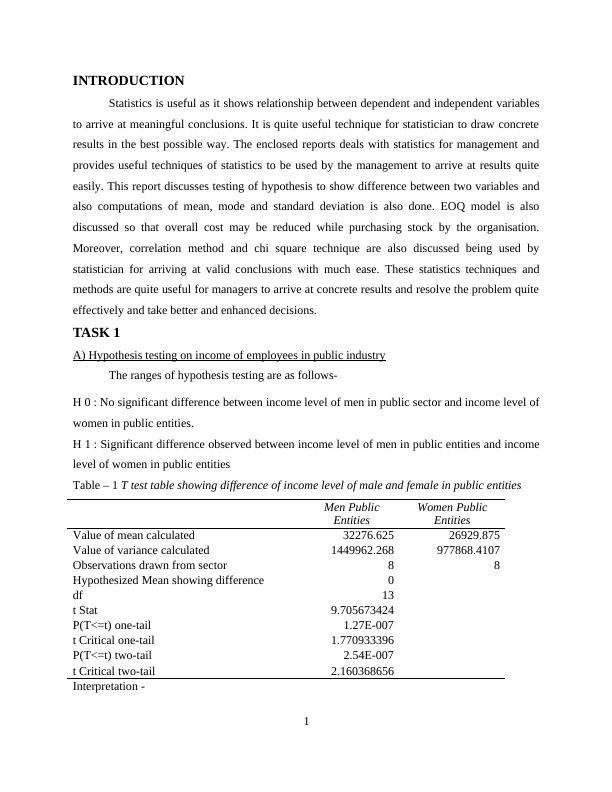
The calculations shown above interpret about significant difference between income level
of male and female in public industry. For showing out such difference, T test is being used for
carrying out difference in income level. The T test shows difference between value of mean and
value of variance obtained. From the calculations carried out in the above table, it can be
observed that level of significant difference is in the range 1.27 > 0.05 which highlights that
there is not much difference observed between income level of men and women in the public
sector quite effectively (Chatterjee and et.al, 2017). This is shown by performing T test
calculation which highlights that no significant difference is analysed. It means that salaries
earned by both male and female workers are almost same at various job position. Moreover, it
can be said that government is not biased on gender and it can be said that gender inequality is
not observed that is a good sign as same salaries are drawn by men and women at the workplace.
Furthermore, T test shows how mean value is deviated from the variable value. Thus,
difference is shown by this technique and is useful for statistician for drawing about conclusions
quite effectively. As the table shows that income level of men in public sector is 32276 and
besides this income level of women in public entities is around 26929. Thus, no significant
difference is observed in income level of both male and female. This is evident that income of
male is around 5347 more than that of women in the public industry at the same position. Apart
from this, value of variance of male is 1449962 and that of women is 977868 which shows that
variance of male is more than that of female by much margin. Thus, variance value of men is
much deviating than that of women in the public sectors.
B) Producing T test based on income level of male and female in the private sectors
Table – 2 T test table showing difference of income level of male and female in private entities
Men Private Entities
Women Private
Entities
Value of mean calculated 28062.875 20541.25
Value of variance calculated 840242.6964 988729.9286
Observations drawn from industry 8 8
Hypothesized Mean showing difference 0
df 14
t Stat 15.73088181
P(T<=t) one-tail 1.35387E-10
t Critical one-tail 1.761310136
P(T<=t) two-tail 2.70773E-10
2
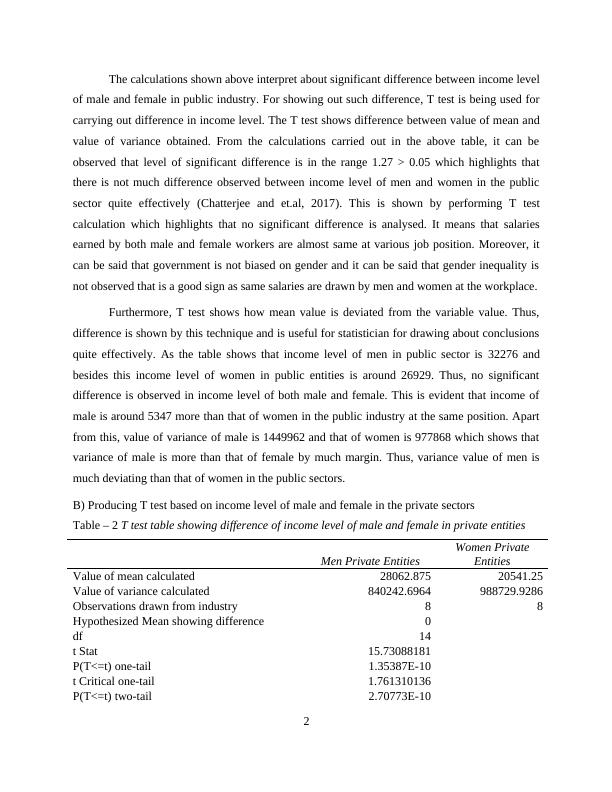
t Critical two-tail 2.144786688
Interpretation -
The table shows significant difference on the basis of income level of men and women at
private sector. For achieving this, T test is applied so that difference can be highlighted with
much ease in the best possible way. The value of significance shown in above calculation ranges
from 1.35 > 0.05. This range shows that not much difference is observed in the salaries earned
by male and female in private entities. As such, mean value of male in private industry is 28062
and in addition to this, mean value of female is 20541. This shows that male income is only 7521
more than that of female at the workplace (Huang, Wu and Yi, 2017). Now coming to variance
value, men has 840242 and value of variance of women is 988729 which have only minor
difference in both income levels. This shows that variance value of men is slightly deviated than
that of women. It can be said that salaries are provided on equal basis to both employees which
is being highlighted by the calculation and as such, private industries are not biased while giving
remuneration to female employees. As such, no gender biasness is observed. Minor difference
can be ignored as not much deviation is observed and this is provided by applying T test which is
a reliable technique used by statistician to draw out meaningful conclusions with much ease from
the statistical data.
C) Producing Earnings – Time chart for male and female in private as well as public sector
3
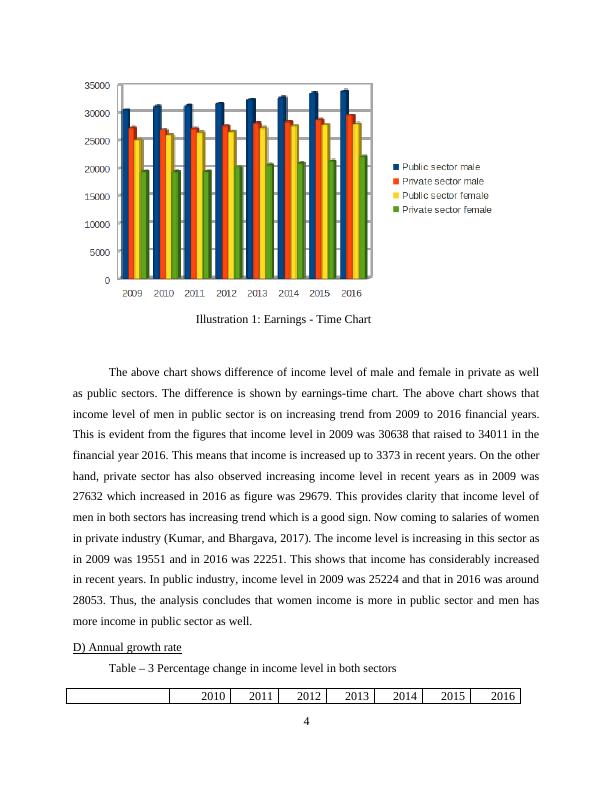
Illustration 1: Earnings - Time Chart
The above chart shows difference of income level of male and female in private as well
as public sectors. The difference is shown by earnings-time chart. The above chart shows that
income level of men in public sector is on increasing trend from 2009 to 2016 financial years.
This is evident from the figures that income level in 2009 was 30638 that raised to 34011 in the
financial year 2016. This means that income is increased up to 3373 in recent years. On the other
hand, private sector has also observed increasing income level in recent years as in 2009 was
27632 which increased in 2016 as figure was 29679. This provides clarity that income level of
men in both sectors has increasing trend which is a good sign. Now coming to salaries of women
in private industry (Kumar, and Bhargava, 2017). The income level is increasing in this sector as
in 2009 was 19551 and in 2016 was 22251. This shows that income has considerably increased
in recent years. In public industry, income level in 2009 was 25224 and that in 2016 was around
28053. Thus, the analysis concludes that women income is more in public sector and men has
more income in public sector as well.
D) Annual growth rate
Table – 3 Percentage change in income level in both sectors
2010 2011 2012 2013 2014 2015 2016
4
End of preview
Want to access all the pages? Upload your documents or become a member.
Related Documents
Statistics for Management : Assignmentlg...
|22
|5114
|86
Statistics For Management TABLE OF CONTENTS INTRODUCTION 1 TASK 11 A) Hypothesis testing on income of employees in public sector 3 D) Annual growth rate 3 TASK 24 2.1 Presenting pictorial form of datalg...
|20
|3380
|304
Assignment on Statistics PDFlg...
|20
|3514
|85
Assignment Statistics for Managementlg...
|22
|4725
|101
Statistical Analysis of Management Payslg...
|18
|3592
|347
Statistics for Management Assignment - Doclg...
|19
|2770
|417