Statistics for management: the difference between earning capacity of men and women employees in public sector
Added on 2020-06-06
20 Pages3435 Words419 Views
Statistics for management
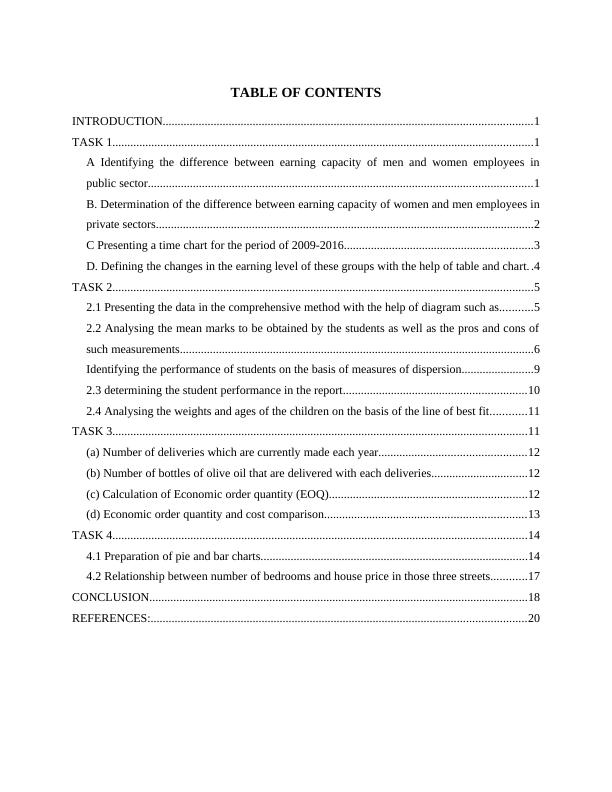
TABLE OF CONTENTSINTRODUCTION...........................................................................................................................1TASK 1............................................................................................................................................1A Identifying the difference between earning capacity of men and women employees inpublic sector................................................................................................................................1B. Determination of the difference between earning capacity of women and men employees inprivate sectors..............................................................................................................................2C Presenting a time chart for the period of 2009-2016...............................................................3D. Defining the changes in the earning level of these groups with the help of table and chart. .4TASK 2............................................................................................................................................52.1 Presenting the data in the comprehensive method with the help of diagram such as...........52.2 Analysing the mean marks to be obtained by the students as well as the pros and cons ofsuch measurements......................................................................................................................6Identifying the performance of students on the basis of measures of dispersion........................92.3 determining the student performance in the report.............................................................102.4 Analysing the weights and ages of the children on the basis of the line of best fit............11TASK 3..........................................................................................................................................11(a) Number of deliveries which are currently made each year.................................................12(b) Number of bottles of olive oil that are delivered with each deliveries................................12(c) Calculation of Economic order quantity (EOQ)..................................................................12(d) Economic order quantity and cost comparison...................................................................13TASK 4..........................................................................................................................................144.1 Preparation of pie and bar charts.........................................................................................144.2 Relationship between number of bedrooms and house price in those three streets............17CONCLUSION..............................................................................................................................18REFERENCES:.............................................................................................................................20
INTRODUCTIONStatistics is the most fundamental tool which is helpful in analysing the adequateoutcomes from the presented data set. Currently many business organisation has implementedthis technique over their financial data set as to analyse the growth, profitability as well asefficiency of the business. These helps the manufacturing units to determine the ability ofproducing the units as well as analysing the reorder level. In the present report there will bevarious measurements and calculations which will be used for analysing the earning efficiency ofthe men and women employees in public as well as private sector. The report will be beneficialas there has been presentation of various graphs and chart that will be helpful tool in terms ofanalysing the variations among such data base.TASK 1A Identifying the difference between earning capacity of men and women employees in publicsectorBasisMen Public sectorWomen Public sector2009306382522420103126426113201131380264702012318162666320133254127338201432878277052015336852790020163401128053Mean32276.62526933.25Variance1449962.27977868.41Observations88Hyp. mean diff.00D/F13T statistics9.71P(T<=t) 1-tail1.27E-007t Critical 1-tail1.770933396P(T<=t) 2-tail2.54E-007t Critical 2-tail2.160368656Interpretation: On the basis of table that reflect the overall gains in public sector whichwere being obtained by men and women workers during the year 2009-2016. However, it can besaid that there is constant increment in the level of earning of men employees as it was 30638 in1
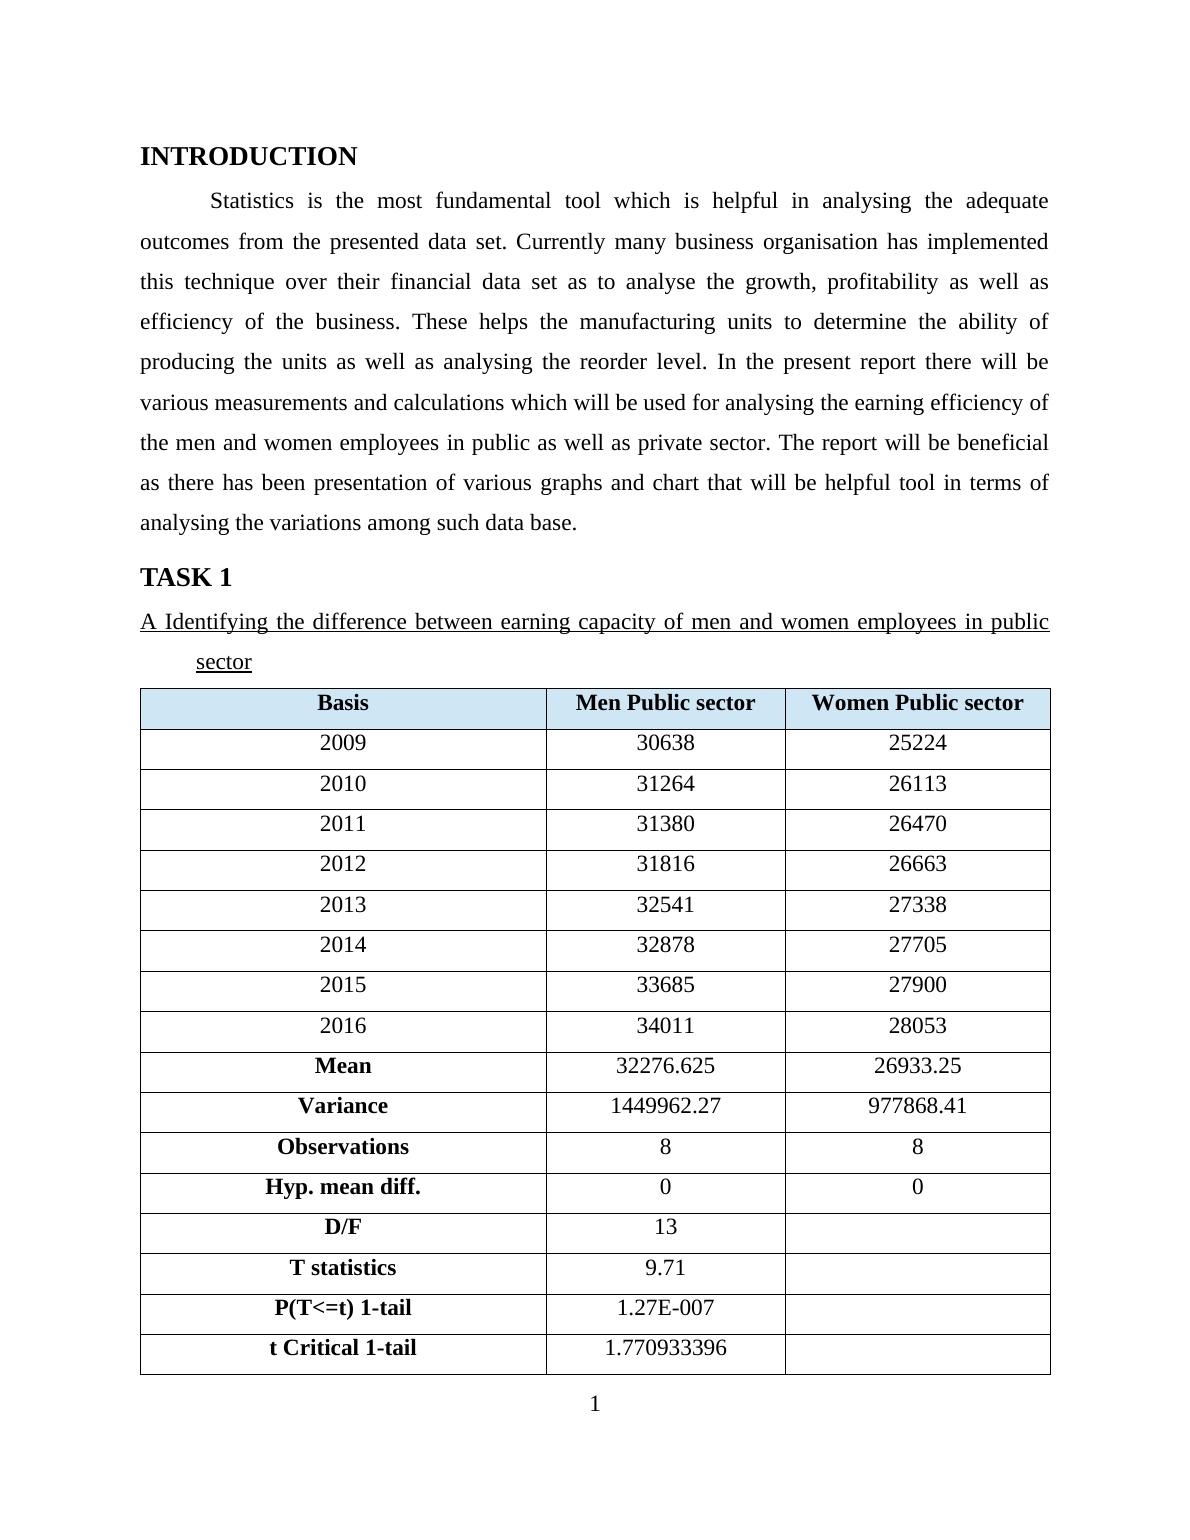
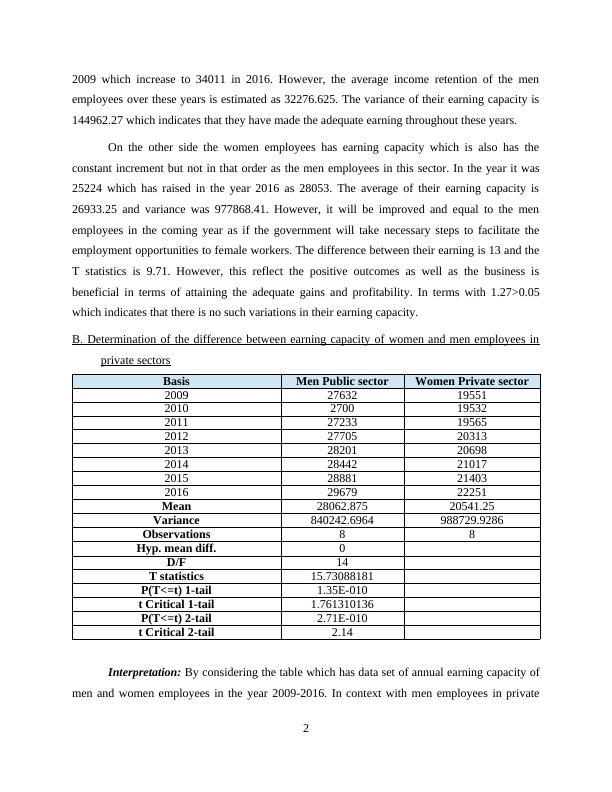
2009 which increase to 34011 in 2016. However, the average income retention of the menemployees over these years is estimated as 32276.625. The variance of their earning capacity is144962.27 which indicates that they have made the adequate earning throughout these years.On the other side the women employees has earning capacity which is also has theconstant increment but not in that order as the men employees in this sector. In the year it was25224 which has raised in the year 2016 as 28053. The average of their earning capacity is26933.25 and variance was 977868.41. However, it will be improved and equal to the menemployees in the coming year as if the government will take necessary steps to facilitate theemployment opportunities to female workers. The difference between their earning is 13 and theT statistics is 9.71. However, this reflect the positive outcomes as well as the business isbeneficial in terms of attaining the adequate gains and profitability. In terms with 1.27>0.05which indicates that there is no such variations in their earning capacity.B. Determination of the difference between earning capacity of women and men employees inprivate sectorsBasisMen Public sectorWomen Private sector200927632195512010270019532201127233195652012277052031320132820120698201428442210172015288812140320162967922251Mean28062.87520541.25Variance840242.6964988729.9286Observations88Hyp. mean diff.0D/F14T statistics15.73088181P(T<=t) 1-tail1.35E-010t Critical 1-tail1.761310136P(T<=t) 2-tail2.71E-010t Critical 2-tail2.14Interpretation: By considering the table which has data set of annual earning capacity ofmen and women employees in the year 2009-2016. In context with men employees in private2
End of preview
Want to access all the pages? Upload your documents or become a member.
Related Documents
Statistics for Management Assignment Solved - Doclg...
|15
|2766
|74
Statistics for Management Assignmentlg...
|19
|3677
|54
Statistics for Management Assignment Reportlg...
|23
|5182
|42
Assignment Statistics for Managementlg...
|22
|4725
|101
Statistics for Management: PDFlg...
|18
|5012
|422
Statistics for Management : Assignmentlg...
|22
|5114
|86