logo

Inflationary Analysis Using Consumer Price Index and Retail Price Index

17 Pages3322 Words335 Views
   

Added on  2020-11-12

About This Document

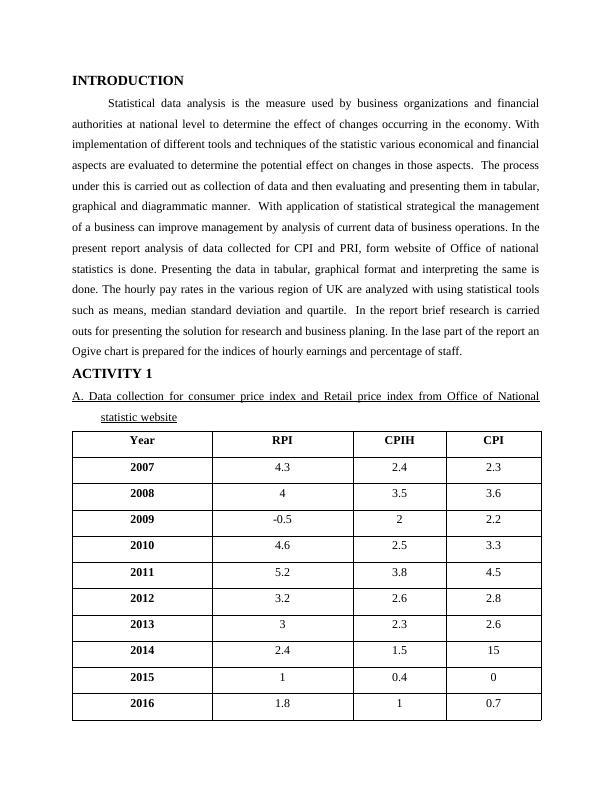
Interpretation of different tools and techniques of the statistic various economical and financial aspects are evaluated to determine the potential effect on changes in those aspects.The process under this is carried out as collection of data and then evaluating and presenting them in tabular, graphical and diagrammatic manner.With applicationofstatistical strategical the management of a business can improve management by analysis of current data of business operations.

Inflationary Analysis Using Consumer Price Index and Retail Price Index

   Added on 2020-11-12

ShareRelated Documents
STATISTICS FOR MANAGEMENT
Inflationary Analysis Using Consumer Price Index and Retail Price Index_1
Table of Contents
INTRODUCTION...........................................................................................................................1
ACTIVITY 1....................................................................................................................................1
A. Data collection for consumer price index and Retail price index from Office of National
statistic website.......................................................................................................................1
B. Reflecting of 10 years data of CPI and RPI in tabular and graphical format....................3
C. Analysing difference between consumer and retail price indices......................................3
D. Using data of CPI and PRI, presenting annular inflation..................................................5
E. presenting the reasons for significance of the infarction..................................................6
ACTIVITY 2....................................................................................................................................6
A. 1 Determination of the value of median and quartile for the per hour earnings................6
A.2 Determination of the value of standard deviation and mean for per hour earnings.......7
B. Comparison of the earning of London and Manchester...................................................8
ACTIVITY 3....................................................................................................................................9
A. Presenting paired t test with significant level of 5%........................................................9
B. Determination of the conditions of paired t teat...............................................................9
C. Construction of the confidence level at 99%..................................................................10
ACTIVITY 4..................................................................................................................................10
A. Presentation of the data of CPI, RPI and CPIH in format of bar graph..........................10
B. Presenting Ogive chart for Cumulative % of staff vs hourly earnings............................11
CONCLUSION..............................................................................................................................11
REFERENCES..............................................................................................................................12
Inflationary Analysis Using Consumer Price Index and Retail Price Index_2
INTRODUCTION
Statistical data analysis is the measure used by business organizations and financial
authorities at national level to determine the effect of changes occurring in the economy. With
implementation of different tools and techniques of the statistic various economical and financial
aspects are evaluated to determine the potential effect on changes in those aspects. The process
under this is carried out as collection of data and then evaluating and presenting them in tabular,
graphical and diagrammatic manner. With application of statistical strategical the management
of a business can improve management by analysis of current data of business operations. In the
present report analysis of data collected for CPI and PRI, form website of Office of national
statistics is done. Presenting the data in tabular, graphical format and interpreting the same is
done. The hourly pay rates in the various region of UK are analyzed with using statistical tools
such as means, median standard deviation and quartile. In the report brief research is carried
outs for presenting the solution for research and business planing. In the lase part of the report an
Ogive chart is prepared for the indices of hourly earnings and percentage of staff.
ACTIVITY 1
A. Data collection for consumer price index and Retail price index from Office of National
statistic website
Year RPI CPIH CPI
2007 4.3 2.4 2.3
2008 4 3.5 3.6
2009 -0.5 2 2.2
2010 4.6 2.5 3.3
2011 5.2 3.8 4.5
2012 3.2 2.6 2.8
2013 3 2.3 2.6
2014 2.4 1.5 15
2015 1 0.4 0
2016 1.8 1 0.7
Inflationary Analysis Using Consumer Price Index and Retail Price Index_3
2017 3.6 2.6 2.7
Interpretation:
The above table presents the data CPI, RPI and CPIH taken from office of national
statistics website. The data is for 10 years from 2007 to 2010 depicting the changes in all three
indices. For all three indices it has been observed that all of them showed thought change ion
year 2011/s for the year 2009 RPI has been measured negative at -0.5 (Baak and et.al., 2015) .
The lowest CPI was in year 2015 at 0, this means the prices change in the commodity basket for
this year was nil. CPIH was lowest for year 2015 at 0.4. with this it can be articulated that the
highest changes in the price were seen in the year 2011 and lowest were seen in 2015.
Consumer price index: this is one of the important measure for decontamination of the
inflation in the UK. This is determined as changes in the prices of goods and commodities in
predetermined basket. The CPI represents the cost of a basket of goods and services across the
country on a monthly basis (U.K. Retail Price Index (RPI), 2018). The goods are divided in
categories like food and beverages, housing, apparel, transportation, medical care, recreation,
education and communication. Change CPI are used to evaluate the affect of price changes on
the cost of living.
Retail price index: RPI is a measure to determine the changes in prices of the fixed
consumer goods and services in the basket. This is also a measure to determined inflation of the
UK. Under RPI changes in price of goods and service are considered which are purchased by
consumer for purpose of consumption.
CPIH: this is an additional measure of consumer price inflation which include a measure
ODF Occupiers housing costs (OOH). This can be elaborated as implicit cost of housing for
owners occupier. The data for this index is given by office of national statistics only.
Inflationary Analysis Using Consumer Price Index and Retail Price Index_4

End of preview

Want to access all the pages? Upload your documents or become a member.

Related Documents
Statistics For Management (pdf)
|15
|3242
|330

(PDF) Statistics for management | Assignment Sample
|15
|2703
|98

Statistics Management Assignment - Solution
|15
|3194
|285

Statistics for Management : PDF
|20
|4443
|300

Statistics for Management Assignment Solution
|16
|3449
|157

Statics for MANAGEMENT INTRODUCTION
|20
|4724
|57