Evaluating the Impact of 3D Films on Audience Over 20 Years
VerifiedAdded on 2019/12/04
|21
|3131
|331
Report
AI Summary
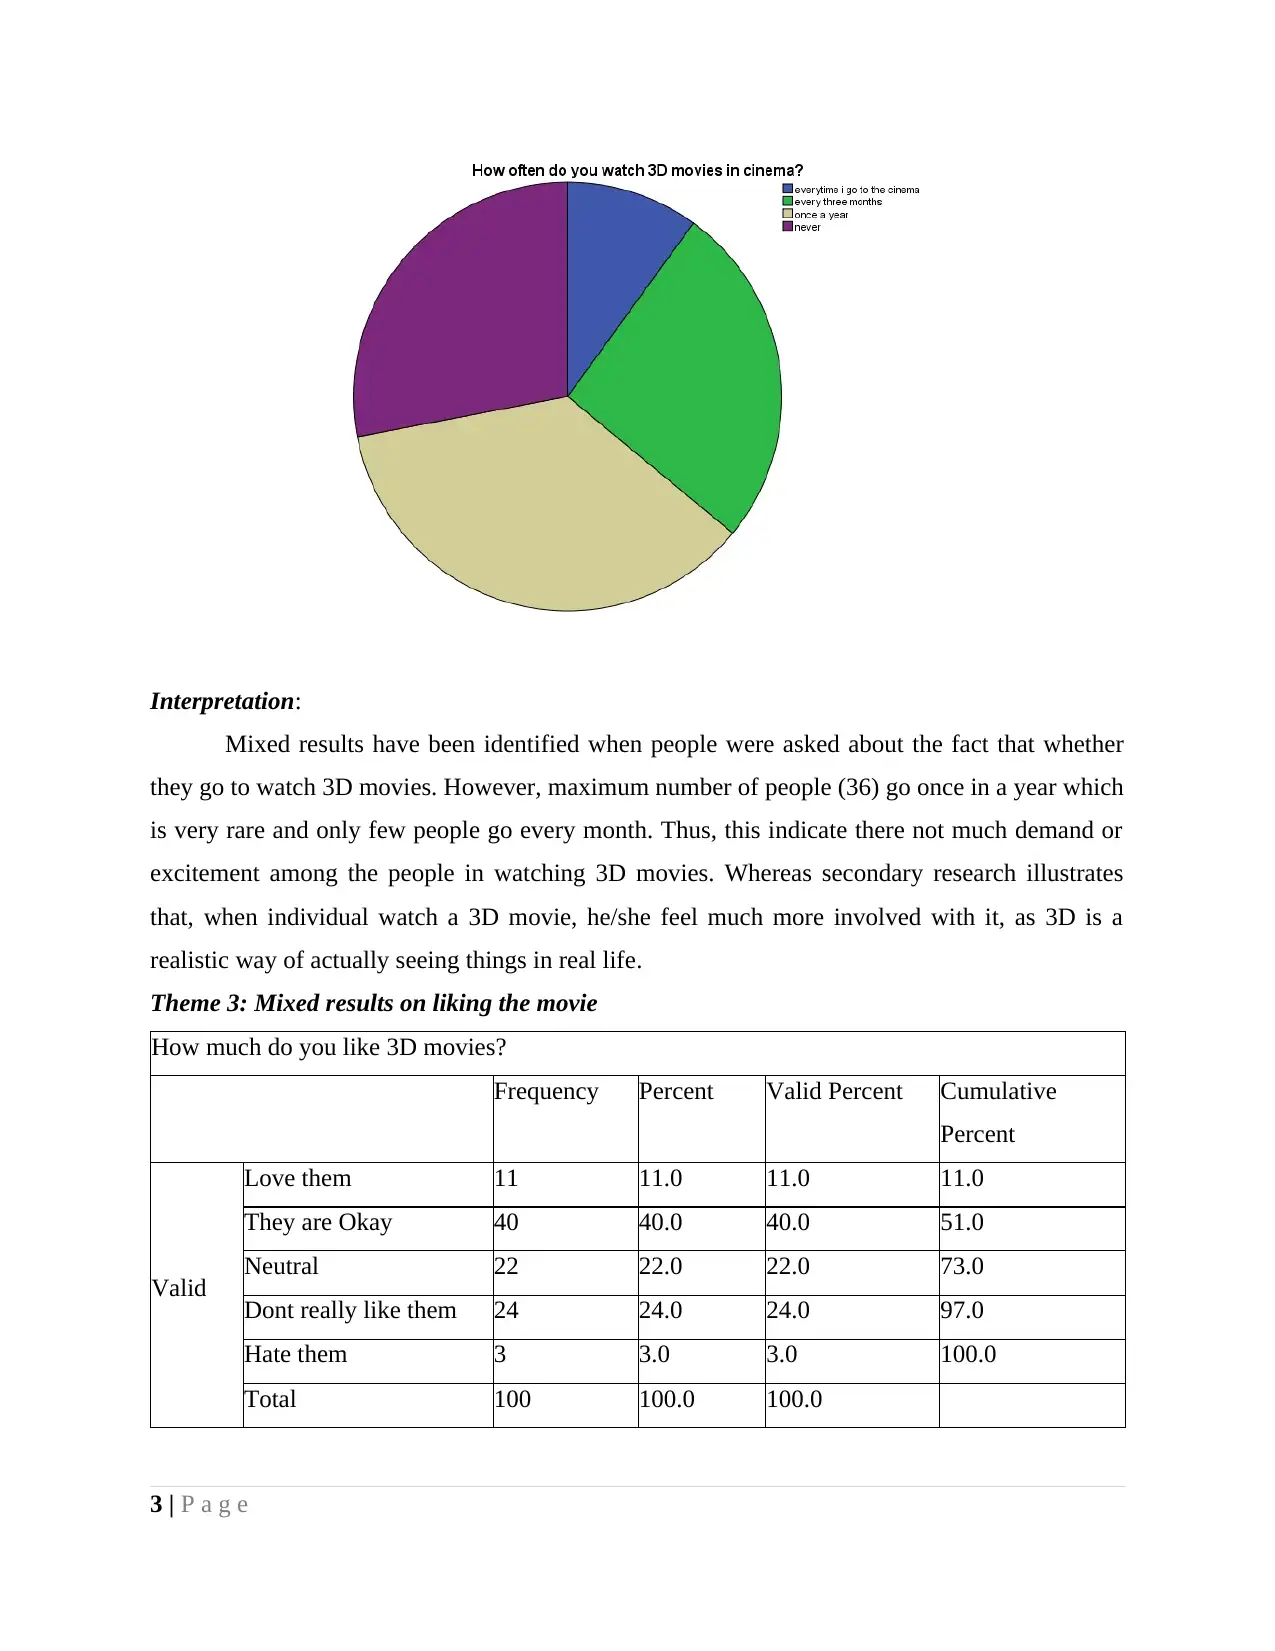
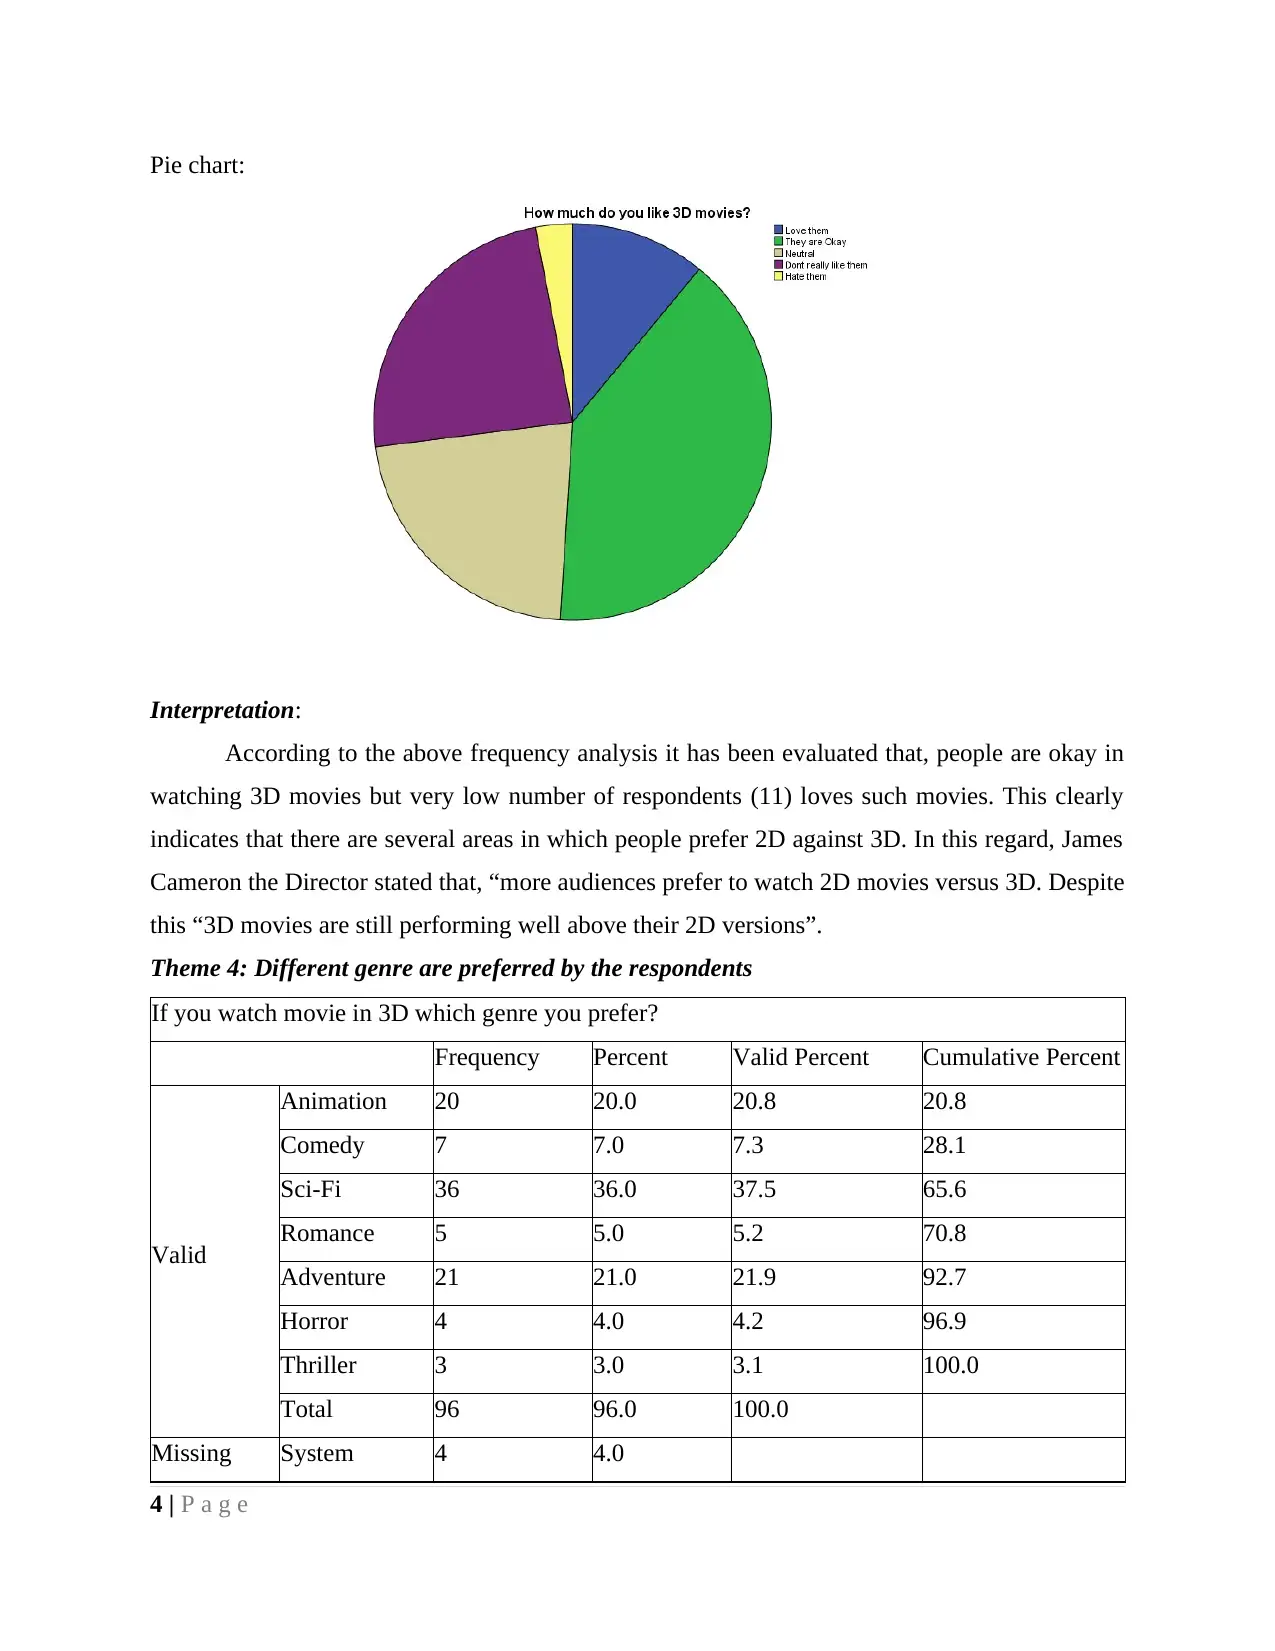
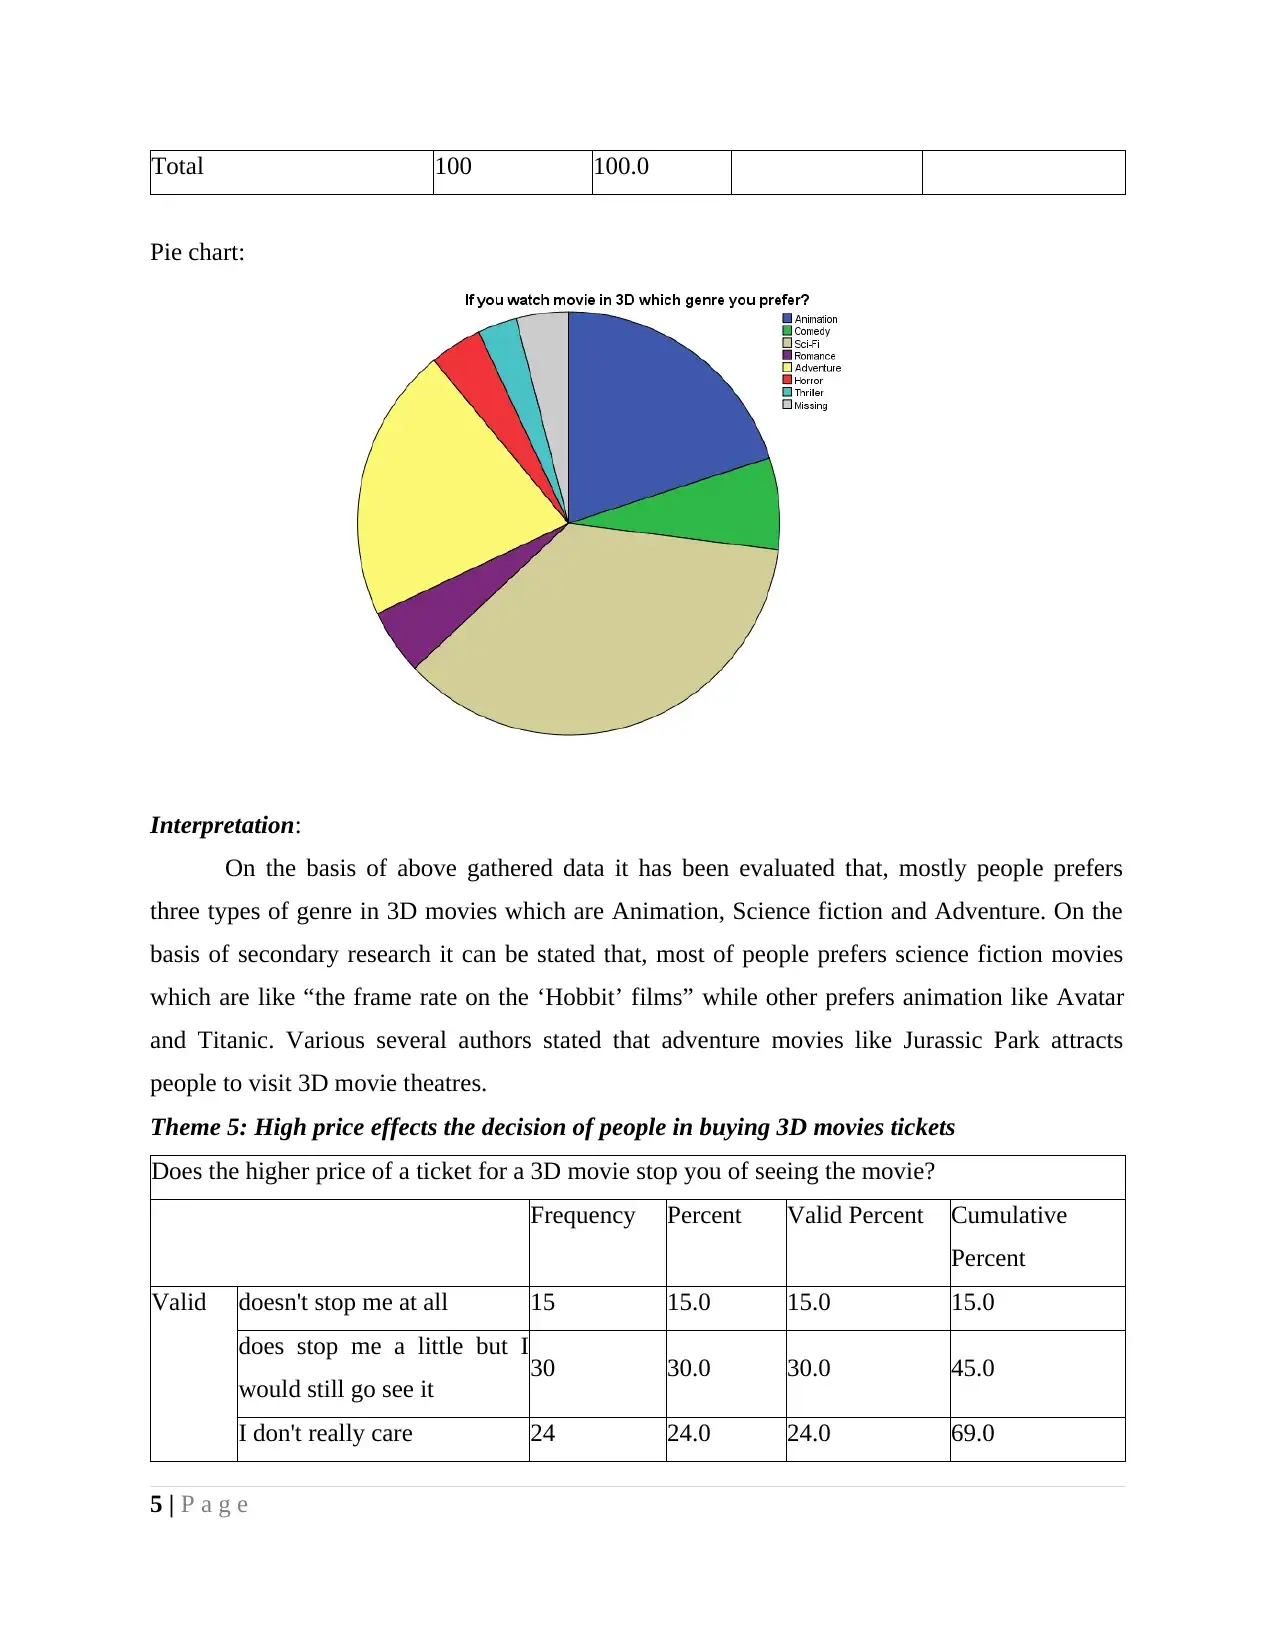
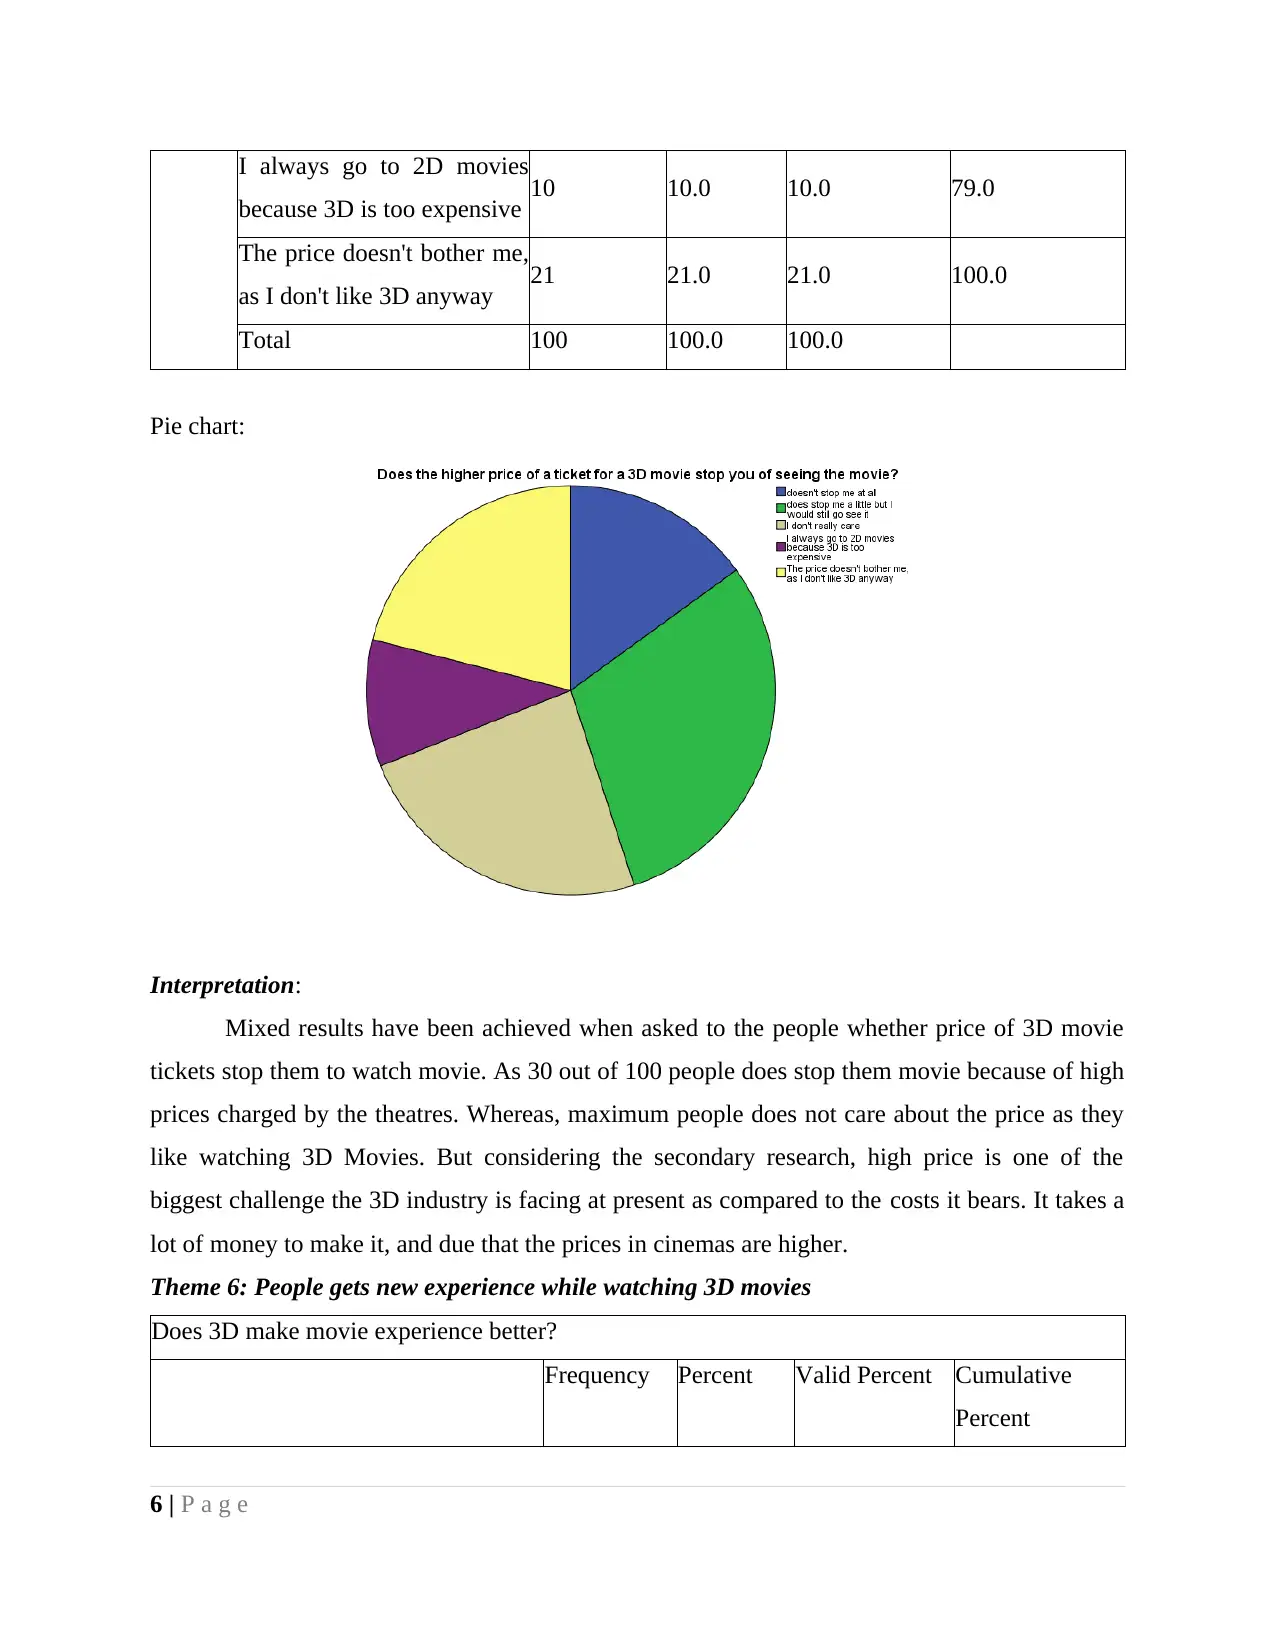
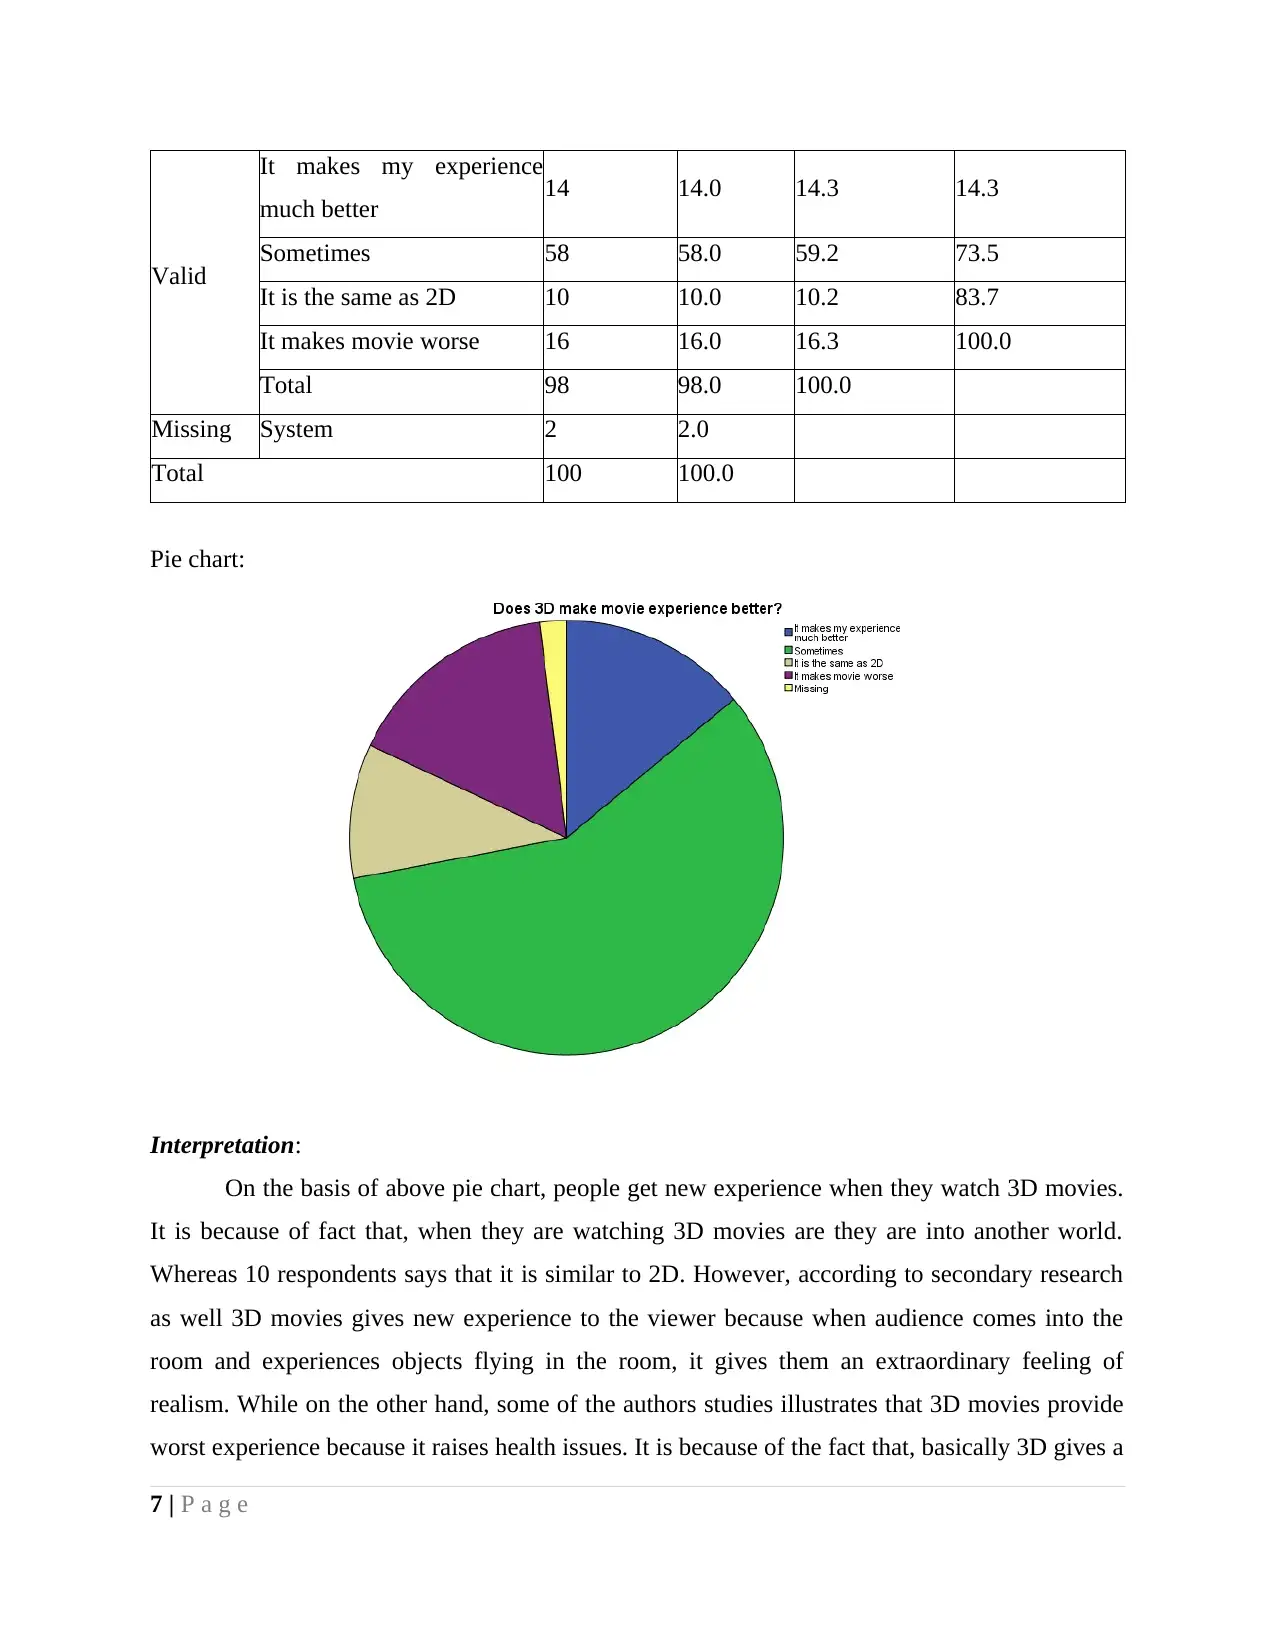
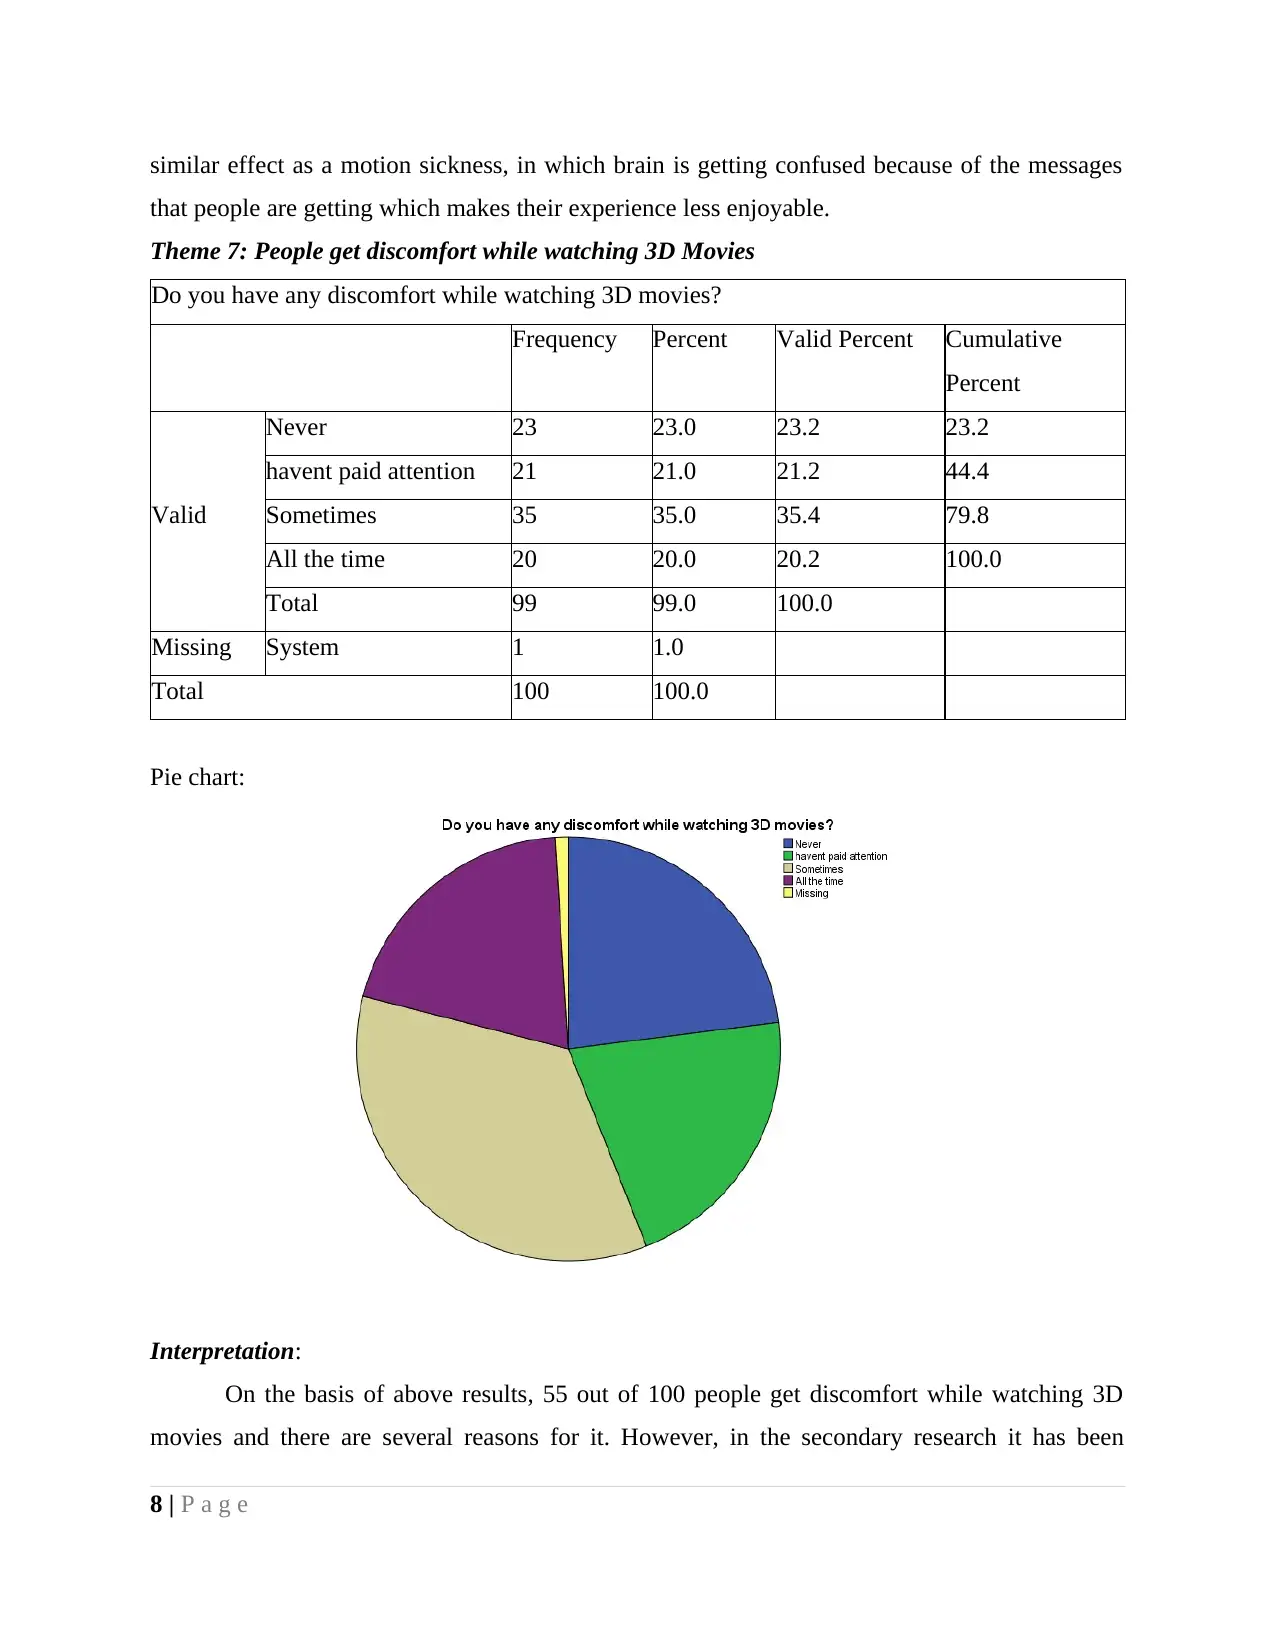
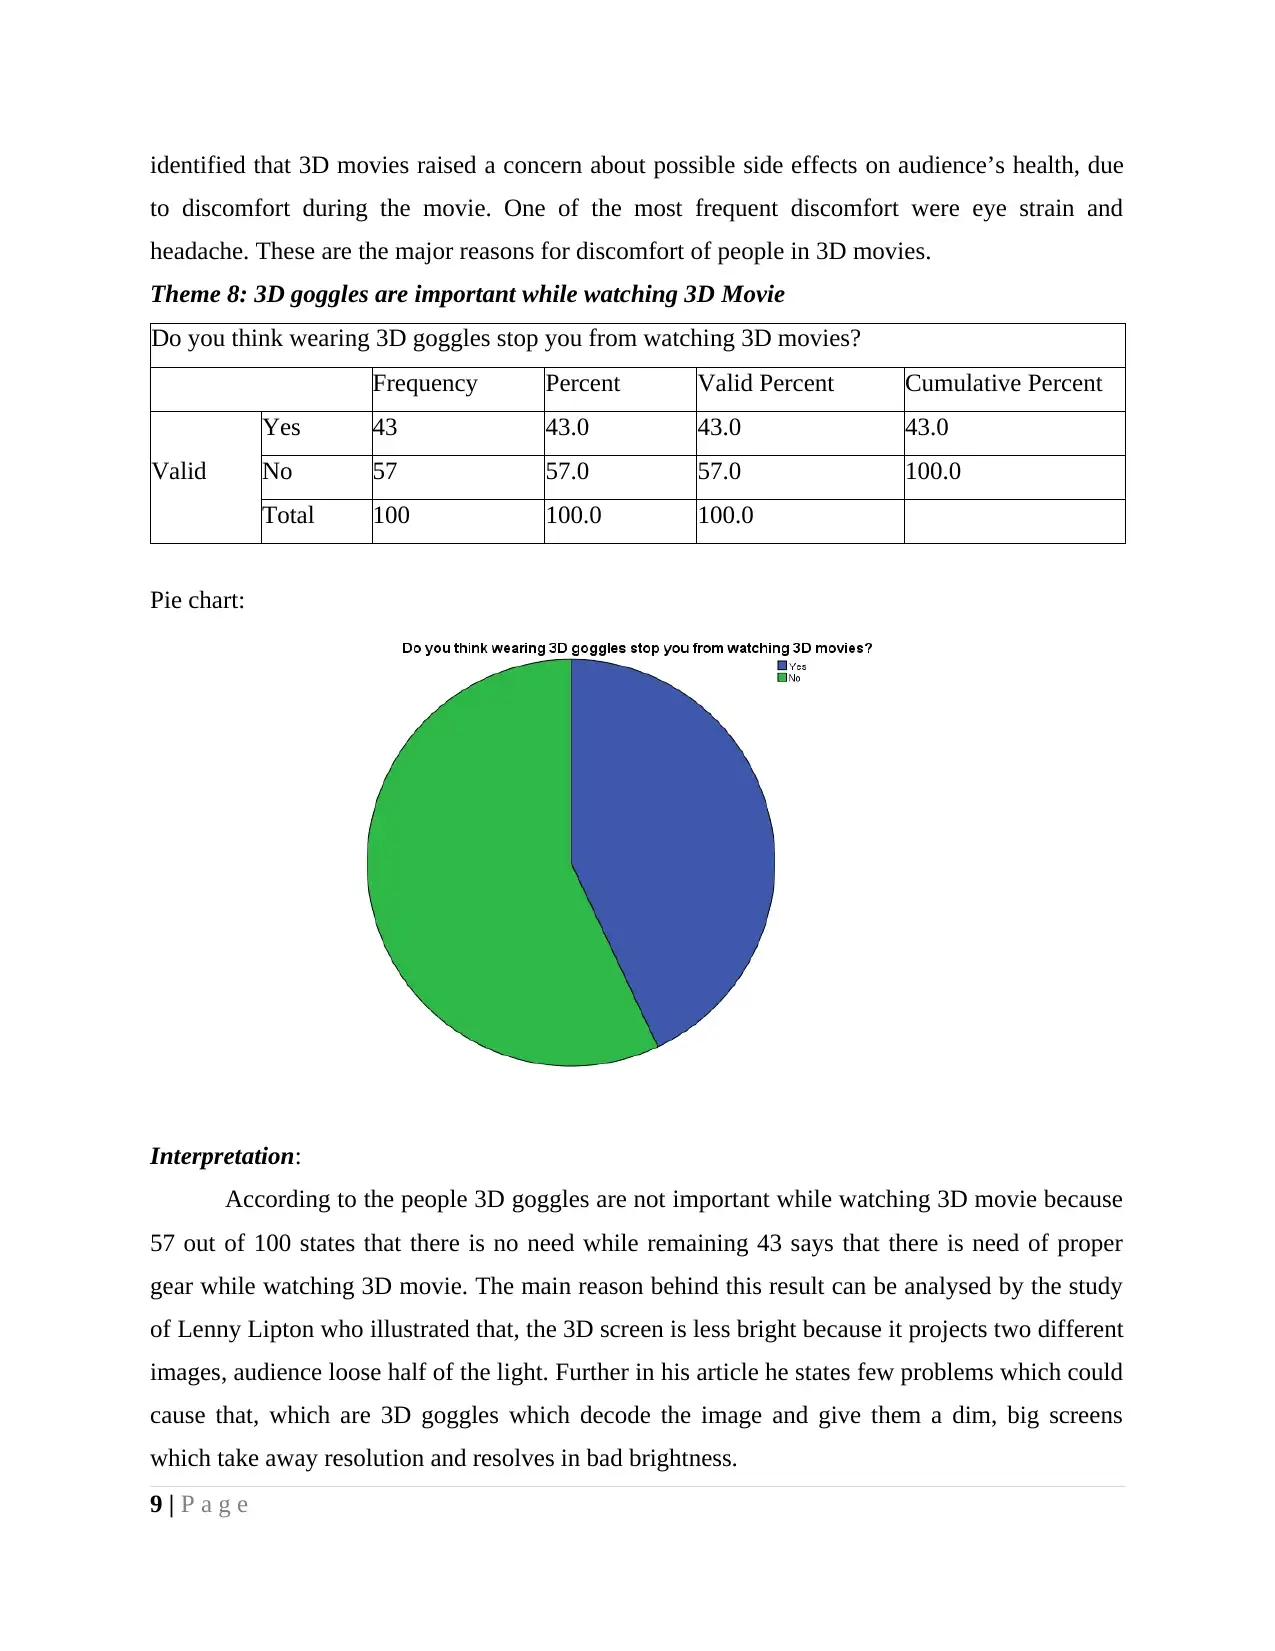
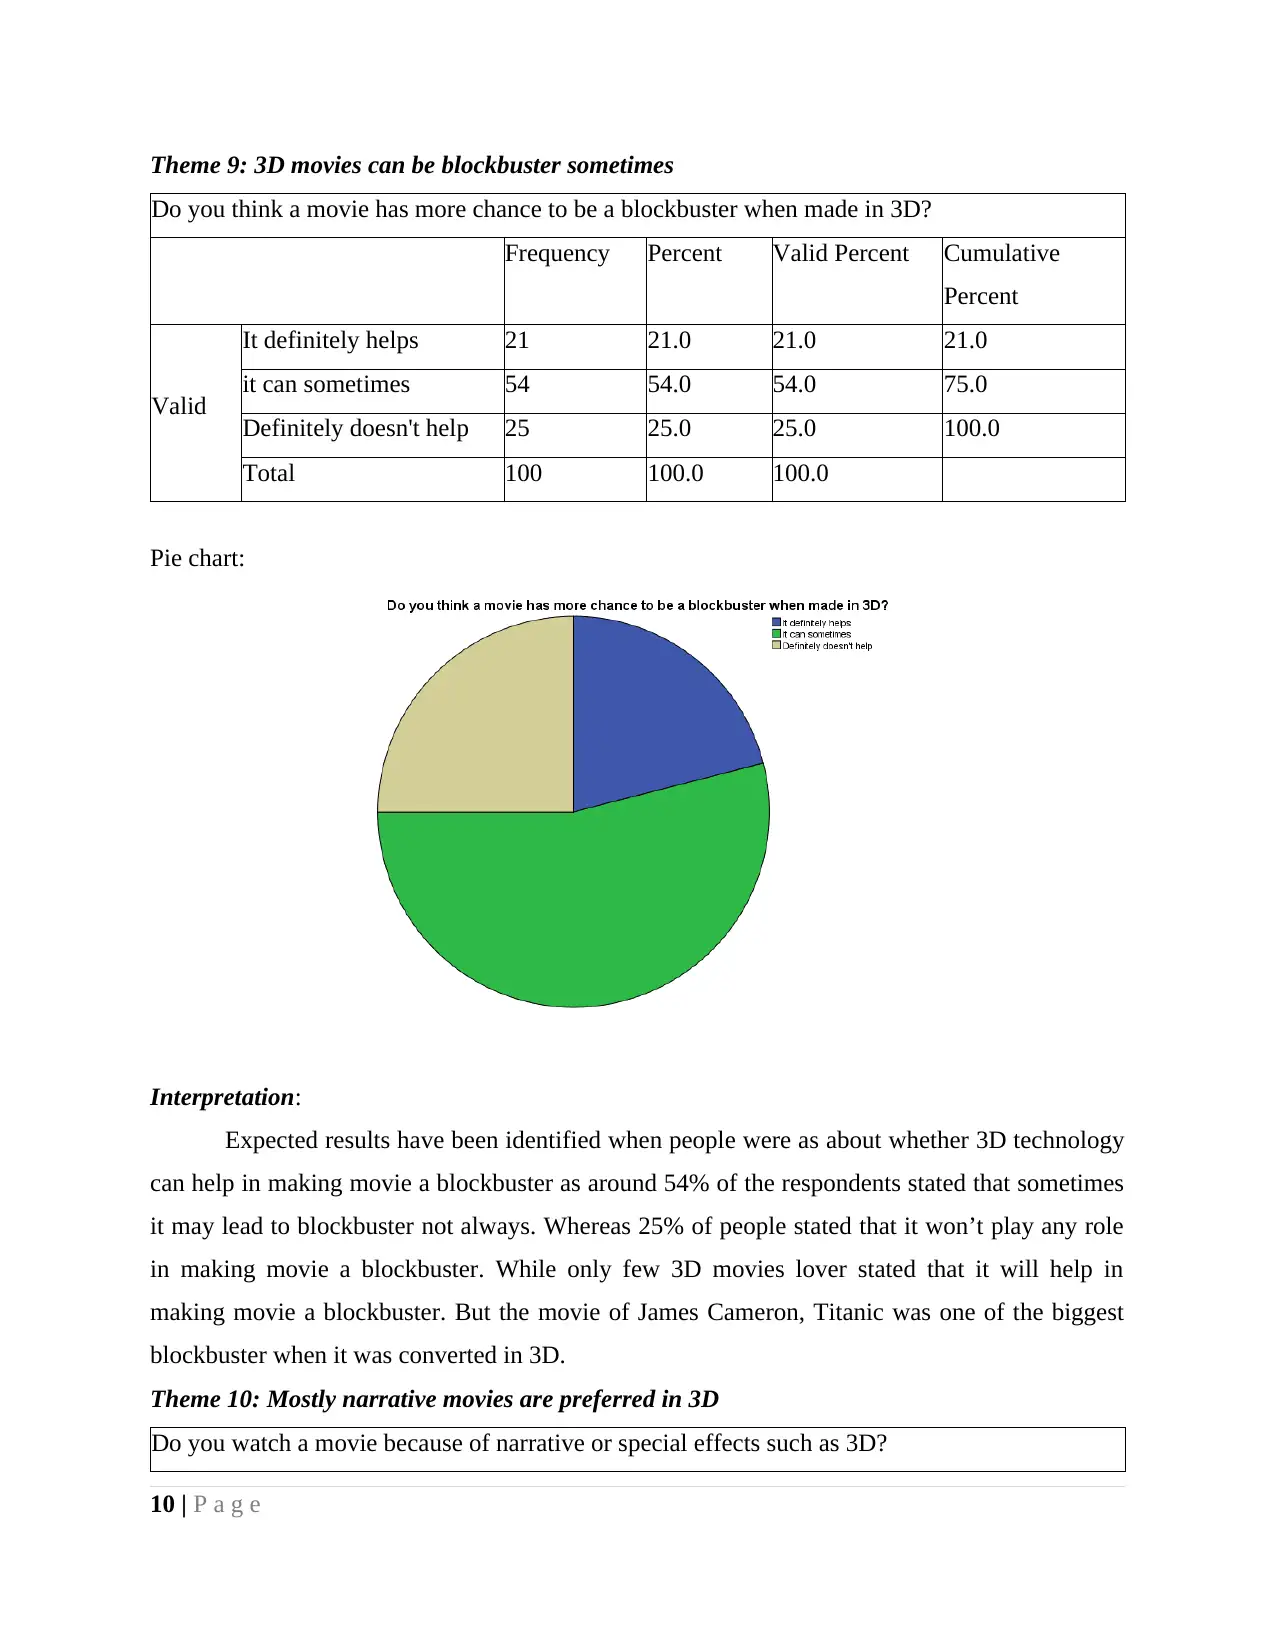
This report examines the audience's reception to 3D films over the past two decades, utilizing SPSS for frequency distribution and thematic analysis to assess whether 3D films have attracted or repelled viewers. The analysis includes data from questionnaires, presented with pie charts, evaluating factors like cinema attendance frequency, 3D movie viewing habits, preferences for different genres, the impact of ticket prices, and the overall 3D movie experience. The study reveals mixed audience responses, with some appreciating the enhanced experience while others express concerns about discomfort and pricing. The report also explores the impact of 3D goggles, the potential for blockbuster success, and the preference for narrative over special effects. The conclusion suggests that while 3D technology has its appeal, factors such as price, comfort, and narrative quality significantly influence audience perception and overall success. Secondary research complements the primary data, providing additional insights into the trends and challenges within the 3D film industry.
Contribute Materials
Your contribution can guide someone’s learning journey. Share your
documents today.

Have 3D films attracted audience or repelled
them in last 20 years?
Secure Best Marks with AI Grader
Need help grading? Try our AI Grader for instant feedback on your assignments.

TABLE OF CONTENTS
Chapter 4: Data Analysis......................................................................................................................
4.1 Introduction............................................................................................................................1
4.2 Frequency Distribution..........................................................................................................1
4.3 Conclusion...........................................................................................................................14
4.4 Recommendation.................................................................................................................14

CHAPTER 4: DATA ANALYSIS
4.1 Introduction
In the present report, researcher focuses on evaluating whether 3D films attracted
audience or repelled them in last 20 years. In this regard, SPSS tool has been undertaken in
which frequency distribution has been conducted to present the responses of respondents with
pie charts so that recommendation can be made.
4.2 Frequency Distribution
In this, thematic analysis has been used in which different themes has been made on the
basis of questionnaire so that each and every aspect about the study can be analysed
appropriately. Further, data gathered from primary and secondary both will be analysed to make
recommendation on future improvements in 3D films.
Theme 1: People visits cinema
How often do you go to the cinema?
Frequency Percent Valid Percent Cumulative
Percent
Valid
Once a week 9 9.0 9.0 9.0
once a month 28 28.0 28.0 37.0
every three months 41 41.0 41.0 78.0
once a year 20 20.0 20.0 98.0
never 2 2.0 2.0 100.0
Total 100 100.0 100.0
Pie chart:
1 | P a g e

Interpretation:
According to the responses identified, most of the respondents go to cinema in every
three months whereas some of them go once in a month. However, there are very low number of
people who go frequently as well as never go to cinema. The identified results can be because of
the reason that, people perceives watching movies in cinema as a major source of entertainment
and in present hectic schedule they barely get the time to visit cinema.
Theme 2: People watches 3D movie once in a while
How often do you watch 3D movies in cinema?
Frequency Percent Valid Percent Cumulative
Percent
Valid
every time I go to the
cinema 10 10.0 10.0 10.0
every three months 26 26.0 26.0 36.0
once a year 36 36.0 36.0 72.0
never 28 28.0 28.0 100.0
Total 100 100.0 100.0
Pie chart:
2 | P a g e
Secure Best Marks with AI Grader
Need help grading? Try our AI Grader for instant feedback on your assignments.

Interpretation:
Mixed results have been identified when people were asked about the fact that whether
they go to watch 3D movies. However, maximum number of people (36) go once in a year which
is very rare and only few people go every month. Thus, this indicate there not much demand or
excitement among the people in watching 3D movies. Whereas secondary research illustrates
that, when individual watch a 3D movie, he/she feel much more involved with it, as 3D is a
realistic way of actually seeing things in real life.
Theme 3: Mixed results on liking the movie
How much do you like 3D movies?
Frequency Percent Valid Percent Cumulative
Percent
Valid
Love them 11 11.0 11.0 11.0
They are Okay 40 40.0 40.0 51.0
Neutral 22 22.0 22.0 73.0
Dont really like them 24 24.0 24.0 97.0
Hate them 3 3.0 3.0 100.0
Total 100 100.0 100.0
3 | P a g e

Pie chart:
Interpretation:
According to the above frequency analysis it has been evaluated that, people are okay in
watching 3D movies but very low number of respondents (11) loves such movies. This clearly
indicates that there are several areas in which people prefer 2D against 3D. In this regard, James
Cameron the Director stated that, “more audiences prefer to watch 2D movies versus 3D. Despite
this “3D movies are still performing well above their 2D versions”.
Theme 4: Different genre are preferred by the respondents
If you watch movie in 3D which genre you prefer?
Frequency Percent Valid Percent Cumulative Percent
Valid
Animation 20 20.0 20.8 20.8
Comedy 7 7.0 7.3 28.1
Sci-Fi 36 36.0 37.5 65.6
Romance 5 5.0 5.2 70.8
Adventure 21 21.0 21.9 92.7
Horror 4 4.0 4.2 96.9
Thriller 3 3.0 3.1 100.0
Total 96 96.0 100.0
Missing System 4 4.0
4 | P a g e

Total 100 100.0
Pie chart:
Interpretation:
On the basis of above gathered data it has been evaluated that, mostly people prefers
three types of genre in 3D movies which are Animation, Science fiction and Adventure. On the
basis of secondary research it can be stated that, most of people prefers science fiction movies
which are like “the frame rate on the ‘Hobbit’ films” while other prefers animation like Avatar
and Titanic. Various several authors stated that adventure movies like Jurassic Park attracts
people to visit 3D movie theatres.
Theme 5: High price effects the decision of people in buying 3D movies tickets
Does the higher price of a ticket for a 3D movie stop you of seeing the movie?
Frequency Percent Valid Percent Cumulative
Percent
Valid doesn't stop me at all 15 15.0 15.0 15.0
does stop me a little but I
would still go see it 30 30.0 30.0 45.0
I don't really care 24 24.0 24.0 69.0
5 | P a g e
Paraphrase This Document
Need a fresh take? Get an instant paraphrase of this document with our AI Paraphraser

I always go to 2D movies
because 3D is too expensive 10 10.0 10.0 79.0
The price doesn't bother me,
as I don't like 3D anyway 21 21.0 21.0 100.0
Total 100 100.0 100.0
Pie chart:
Interpretation:
Mixed results have been achieved when asked to the people whether price of 3D movie
tickets stop them to watch movie. As 30 out of 100 people does stop them movie because of high
prices charged by the theatres. Whereas, maximum people does not care about the price as they
like watching 3D Movies. But considering the secondary research, high price is one of the
biggest challenge the 3D industry is facing at present as compared to the costs it bears. It takes a
lot of money to make it, and due that the prices in cinemas are higher.
Theme 6: People gets new experience while watching 3D movies
Does 3D make movie experience better?
Frequency Percent Valid Percent Cumulative
Percent
6 | P a g e

Valid
It makes my experience
much better 14 14.0 14.3 14.3
Sometimes 58 58.0 59.2 73.5
It is the same as 2D 10 10.0 10.2 83.7
It makes movie worse 16 16.0 16.3 100.0
Total 98 98.0 100.0
Missing System 2 2.0
Total 100 100.0
Pie chart:
Interpretation:
On the basis of above pie chart, people get new experience when they watch 3D movies.
It is because of fact that, when they are watching 3D movies are they are into another world.
Whereas 10 respondents says that it is similar to 2D. However, according to secondary research
as well 3D movies gives new experience to the viewer because when audience comes into the
room and experiences objects flying in the room, it gives them an extraordinary feeling of
realism. While on the other hand, some of the authors studies illustrates that 3D movies provide
worst experience because it raises health issues. It is because of the fact that, basically 3D gives a
7 | P a g e

similar effect as a motion sickness, in which brain is getting confused because of the messages
that people are getting which makes their experience less enjoyable.
Theme 7: People get discomfort while watching 3D Movies
Do you have any discomfort while watching 3D movies?
Frequency Percent Valid Percent Cumulative
Percent
Valid
Never 23 23.0 23.2 23.2
havent paid attention 21 21.0 21.2 44.4
Sometimes 35 35.0 35.4 79.8
All the time 20 20.0 20.2 100.0
Total 99 99.0 100.0
Missing System 1 1.0
Total 100 100.0
Pie chart:
Interpretation:
On the basis of above results, 55 out of 100 people get discomfort while watching 3D
movies and there are several reasons for it. However, in the secondary research it has been
8 | P a g e
Secure Best Marks with AI Grader
Need help grading? Try our AI Grader for instant feedback on your assignments.

identified that 3D movies raised a concern about possible side effects on audience’s health, due
to discomfort during the movie. One of the most frequent discomfort were eye strain and
headache. These are the major reasons for discomfort of people in 3D movies.
Theme 8: 3D goggles are important while watching 3D Movie
Do you think wearing 3D goggles stop you from watching 3D movies?
Frequency Percent Valid Percent Cumulative Percent
Valid
Yes 43 43.0 43.0 43.0
No 57 57.0 57.0 100.0
Total 100 100.0 100.0
Pie chart:
Interpretation:
According to the people 3D goggles are not important while watching 3D movie because
57 out of 100 states that there is no need while remaining 43 says that there is need of proper
gear while watching 3D movie. The main reason behind this result can be analysed by the study
of Lenny Lipton who illustrated that, the 3D screen is less bright because it projects two different
images, audience loose half of the light. Further in his article he states few problems which could
cause that, which are 3D goggles which decode the image and give them a dim, big screens
which take away resolution and resolves in bad brightness.
9 | P a g e

Theme 9: 3D movies can be blockbuster sometimes
Do you think a movie has more chance to be a blockbuster when made in 3D?
Frequency Percent Valid Percent Cumulative
Percent
Valid
It definitely helps 21 21.0 21.0 21.0
it can sometimes 54 54.0 54.0 75.0
Definitely doesn't help 25 25.0 25.0 100.0
Total 100 100.0 100.0
Pie chart:
Interpretation:
Expected results have been identified when people were as about whether 3D technology
can help in making movie a blockbuster as around 54% of the respondents stated that sometimes
it may lead to blockbuster not always. Whereas 25% of people stated that it won’t play any role
in making movie a blockbuster. While only few 3D movies lover stated that it will help in
making movie a blockbuster. But the movie of James Cameron, Titanic was one of the biggest
blockbuster when it was converted in 3D.
Theme 10: Mostly narrative movies are preferred in 3D
Do you watch a movie because of narrative or special effects such as 3D?
10 | P a g e

Frequency Percent Valid Percent Cumulative
Percent
Valid
Narrative 47 47.0 47.5 47.5
Special effect 15 15.0 15.2 62.6
both 37 37.0 37.4 100.0
Total 99 99.0 100.0
Missing System 1 1.0
Total 100 100.0
Pie chart:
Interpretation:
People go to cinema to see movie because of its story and content, not because of the 3D
effects. 3D is just a feature which adds a depth to the story and will let the audience enjoy the
story more. So 3D and 2D movies have to be produced the same way, in order to get more
audience it needs a good plot. Thus, this is the major reason behind which most of the
respondents around 47.5% prefers narrative type of movie when watching 3D movies.
Supporting to this, secondary research evaluated that, most successful in 3D that have not forgot
about narrative and 3D were Avatar and Gravity, which successfully hit the box office.
Theme 11: Adjusted 3D movies
11 | P a g e
Paraphrase This Document
Need a fresh take? Get an instant paraphrase of this document with our AI Paraphraser

Are you aware that certain movies are filmed in 3D while others are only adjusted for the 3D
screen afterwards? Knowing this would you be more likely to go to a 3D cinema if you knew the
movie was filmed in 3D from the beginning?
Frequency Percent Valid Percent Cumulative
Percent
Valid
I didn't know, but I still
would go 13 13.0 13.0 13.0
I knew, and still watch any
3D movie 21 21.0 21.0 34.0
It doesn't change anything 29 29.0 29.0 63.0
Would go to see it more
often 21 21.0 21.0 84.0
Still don't like 3D 16 16.0 16.0 100.0
Total 100 100.0 100.0
Pie chart:
Interpretation:
Unexpected outcomes were generated when asked to the people about whether they
would watch an adjusted 3D movie but most of the respondents around 84% people will go to
12 | P a g e

watch movies despite of knowing this fact. This shows the love affair of people with 3D movies
as they will go in any condition to watch a 3D movie and gain new experience.
Theme 12: People are not sure that 3D movies will be more successful than 2D
Do you think in future 3D will be more successful that 2D movies?
Frequency Percent Valid Percent Cumulative Percent
Valid
Definitely 24 24.0 24.0 24.0
Not sure 47 47.0 47.0 71.0
Unlikely 29 29.0 29.0 100.0
Total 100 100.0 100.0
Pie chart:
Interpretation:
Through the means of above pie chart it has been evaluated that, 47 out of 100
respondents are not sure whether 3D movies will be more successful than 2D despite they have
examples like Avatar, Jurassic Park, and Titanic etc. While on the other hand, remaining 24
respondents’ states that definitely 3D movies will overcome 2D one day because of their
advanced technology use and constantly providing new experience to the viewers.
Theme 13: People think 3D will go out of style the way it did in the past
13 | P a g e

3Dmoviesgooutofstyle
Frequency Percent Valid Percent Cumulative Percent
Valid
Yes 50 50.0 51.0 51.0
No 48 48.0 49.0 100.0
Total 98 98.0 100.0
Missing System 2 2.0
Total 100 100.0
Chart:
Interpretation:
On the basis of above chart it has been evaluated that 50% of respondent’s thinks that 3D
movies will go out of style as they did in past. But 48% people are saying no to this fact and
thinks that nowadays, level of 3D movies has reached to its finest quality which is constantly
attracting large number of population towards.
Theme 14: People do not research on filming process before choosing between 3D and 2D
Research on 3D and 2D Movies
Frequency Percent Valid Percent Cumulative Percent
Valid Yes 20 20.0 20.4 20.4
No 52 52.0 53.1 73.5
14 | P a g e
Frequency Percent Valid Percent Cumulative Percent
Valid
Yes 50 50.0 51.0 51.0
No 48 48.0 49.0 100.0
Total 98 98.0 100.0
Missing System 2 2.0
Total 100 100.0
Chart:
Interpretation:
On the basis of above chart it has been evaluated that 50% of respondent’s thinks that 3D
movies will go out of style as they did in past. But 48% people are saying no to this fact and
thinks that nowadays, level of 3D movies has reached to its finest quality which is constantly
attracting large number of population towards.
Theme 14: People do not research on filming process before choosing between 3D and 2D
Research on 3D and 2D Movies
Frequency Percent Valid Percent Cumulative Percent
Valid Yes 20 20.0 20.4 20.4
No 52 52.0 53.1 73.5
14 | P a g e
Secure Best Marks with AI Grader
Need help grading? Try our AI Grader for instant feedback on your assignments.

I dont care 26 26.0 26.5 100.0
Total 98 98.0 100.0
Missing System 2 2.0
Total 100 100.0
Chart:
Interpretation:
Through the means of frequency distribution it has been evaluated that, 52 out of 100
respondents do not research on filming process before choosing between 3D and 2D. Whereas
remaining 20 participants does and accordingly selects the movie to watch. In addition to it, there
are 26 people who does not care they just watch movie for fun and does not require any research
before choosing movie between 3D and 2D.
Theme 15: Respondents does not consume 3D movie at home on TV
3DMovieatHome
Frequency Percent Valid Percent Cumulative
Percent
15 | P a g e

Valid
Yes I prefer it more than
cinema 17 17.0 17.0 17.0
Sometimes, but the effect is
not the same 13 13.0 13.0 30.0
Never 70 70.0 70.0 100.0
Total 100 100.0 100.0
Chart:
Interpretation:
On the basis of above pie chart, 17% of respondents prefer to watch 3D movies at home
rather than cinemas. While 13% prefers sometimes because they think the effect of movie is not
same or up to the mark as in theatre. While on the other hand, 70% never watches 3D Movies at
home because they think its actual fun is on big screen.
Theme 16: 2D is more preferred movies
What you prefer 2D or 3D movies
Frequency Percent Valid Percent Cumulative Percent
Valid 2D 72 72.0 74.2 74.2
16 | P a g e

3D 25 25.0 25.8 100.0
Total 97 97.0 100.0
Missing System 3 3.0
Total 100 100.0
Chart:
Interpretation:
Expected results were identified when asked to the people about whether they prefer 2D
or 3D movies. However, 72 out of 100 respondents stated that they prefer 2D movies because
they can connect to such movies more easily and effectively. While on the other hand, 25 people
out of 100 states that they prefer 3D movies because they are more attractive.
Theme 17: Despite of price be the same people would still choose 2D over 3D
If the price be the same would you still choose 2D over 3D?
Frequency Percent Valid Percent Cumulative Percent
Valid
Yes 54 54.0 54.5 54.5
No 45 45.0 45.5 100.0
Total 99 99.0 100.0
17 | P a g e
Paraphrase This Document
Need a fresh take? Get an instant paraphrase of this document with our AI Paraphraser

Missing System 1 1.0
Total 100 100.0
Chart:
Interpretation:
From the above pie chart it has been evaluated that, despite of price similarity 54
respondents out of 100 will choose 2D movies over 3D movies. Whereas, getting price benefit
will encourage 45 people to switch over 2D movies to 3D movies.
4.3 Conclusion
In conclusion to the above data analysis it has been evaluated that, 3D movies are making
their mark in the mind of people as they are preferring to watch such movies despite of several
negative factors. However, the most preferred genres by the people are animation, adventure and
science fiction while watching a 3D movie. Furthermore, people get discomfort while watching
the movie because 3D technology directly effects individual’s eye and leads to strain and
headache. Despite of high prices charged by theatres people like to watch 3D movie because it
provides them new level of experience.
18 | P a g e

4.4 Recommendation
On the basis of above study there are varied recommendation that can be given to the 3D
industry so that they can attract large audience and generate higher revenues:
The price of 3D movie should be reduced so that middle class people can also afford and
watch 3D Movies more often.
Industry should promote the 3D movies in Animation, Adventure and Science fiction
genre because it is the most preferred by the people.
New measures should be employed to overcome the discomfort of people such as eye
strain or headache. By focusing on health and safety measures, industry will attract large
number of audience to the 3D theatres and generate higher revenues.
Further, Narrative movies should be promoted because people like such movies.
Industry should make use of trending marketing and promotional techniques to create
awareness about the concept of 3D movies so that more people can be encouraged or
influenced to watch 3D movies more than often.
19 | P a g e
1 out of 21
Related Documents

Your All-in-One AI-Powered Toolkit for Academic Success.
+13062052269
info@desklib.com
Available 24*7 on WhatsApp / Email
Unlock your academic potential
© 2024 | Zucol Services PVT LTD | All rights reserved.