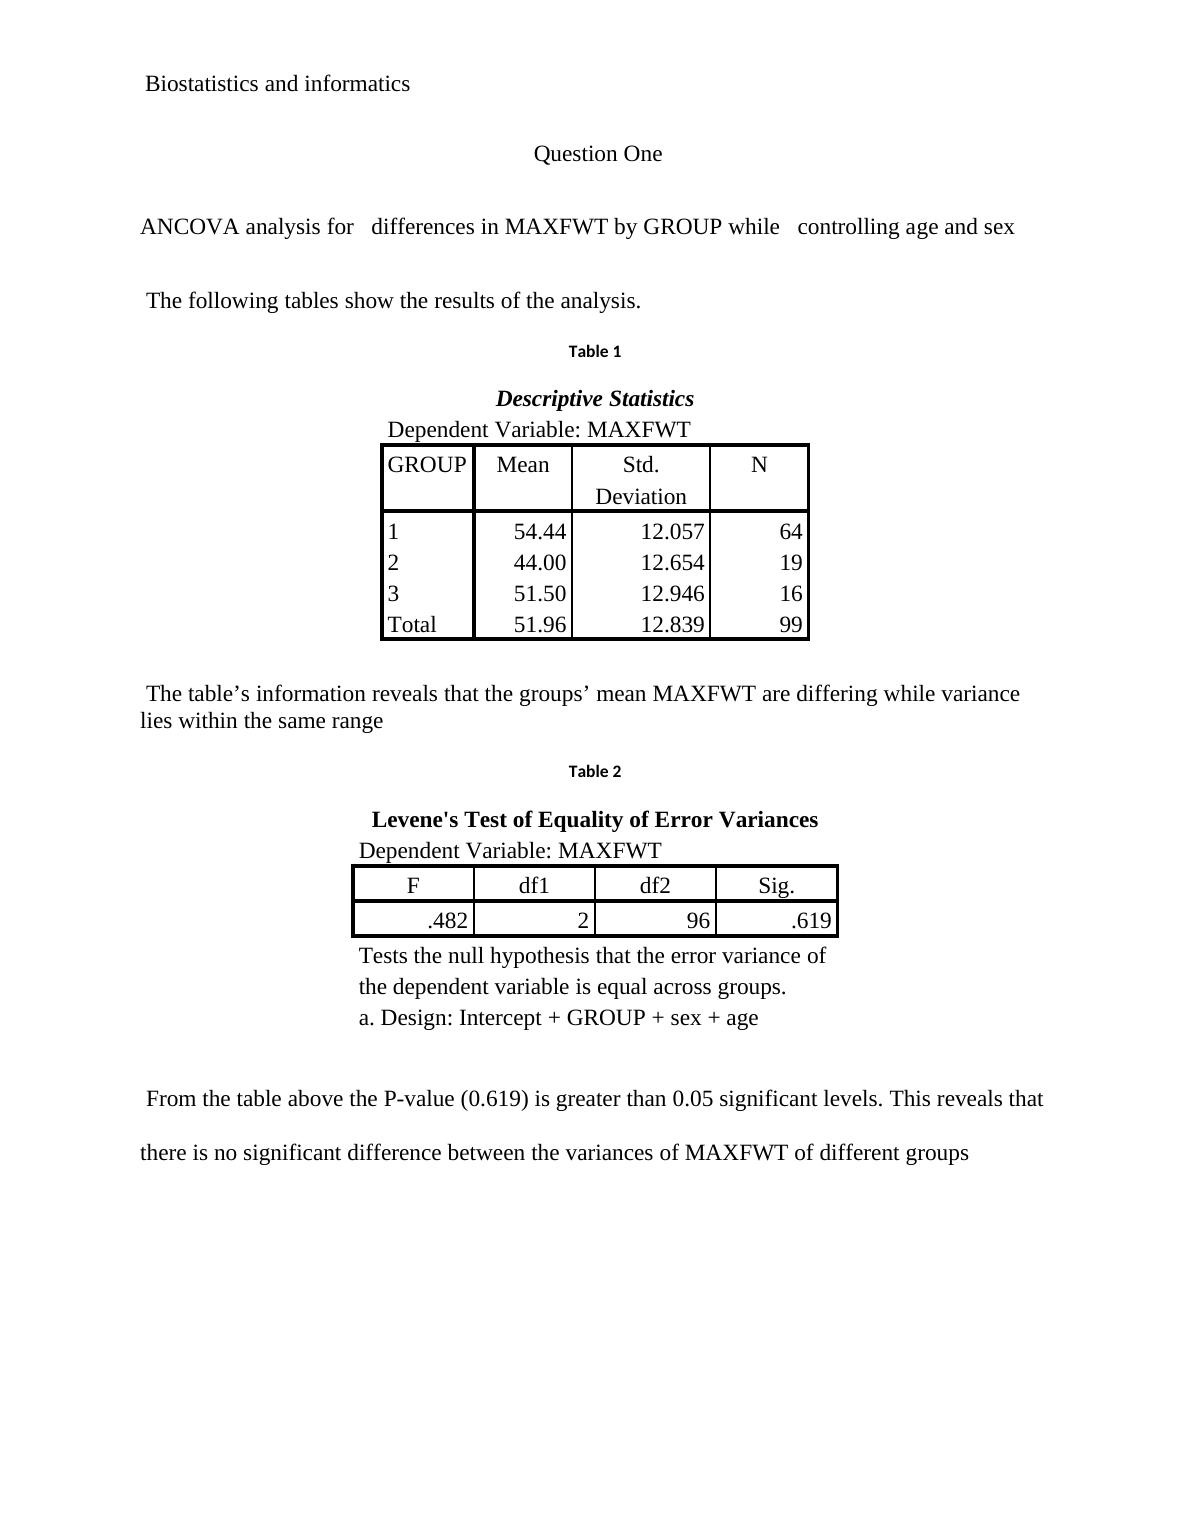
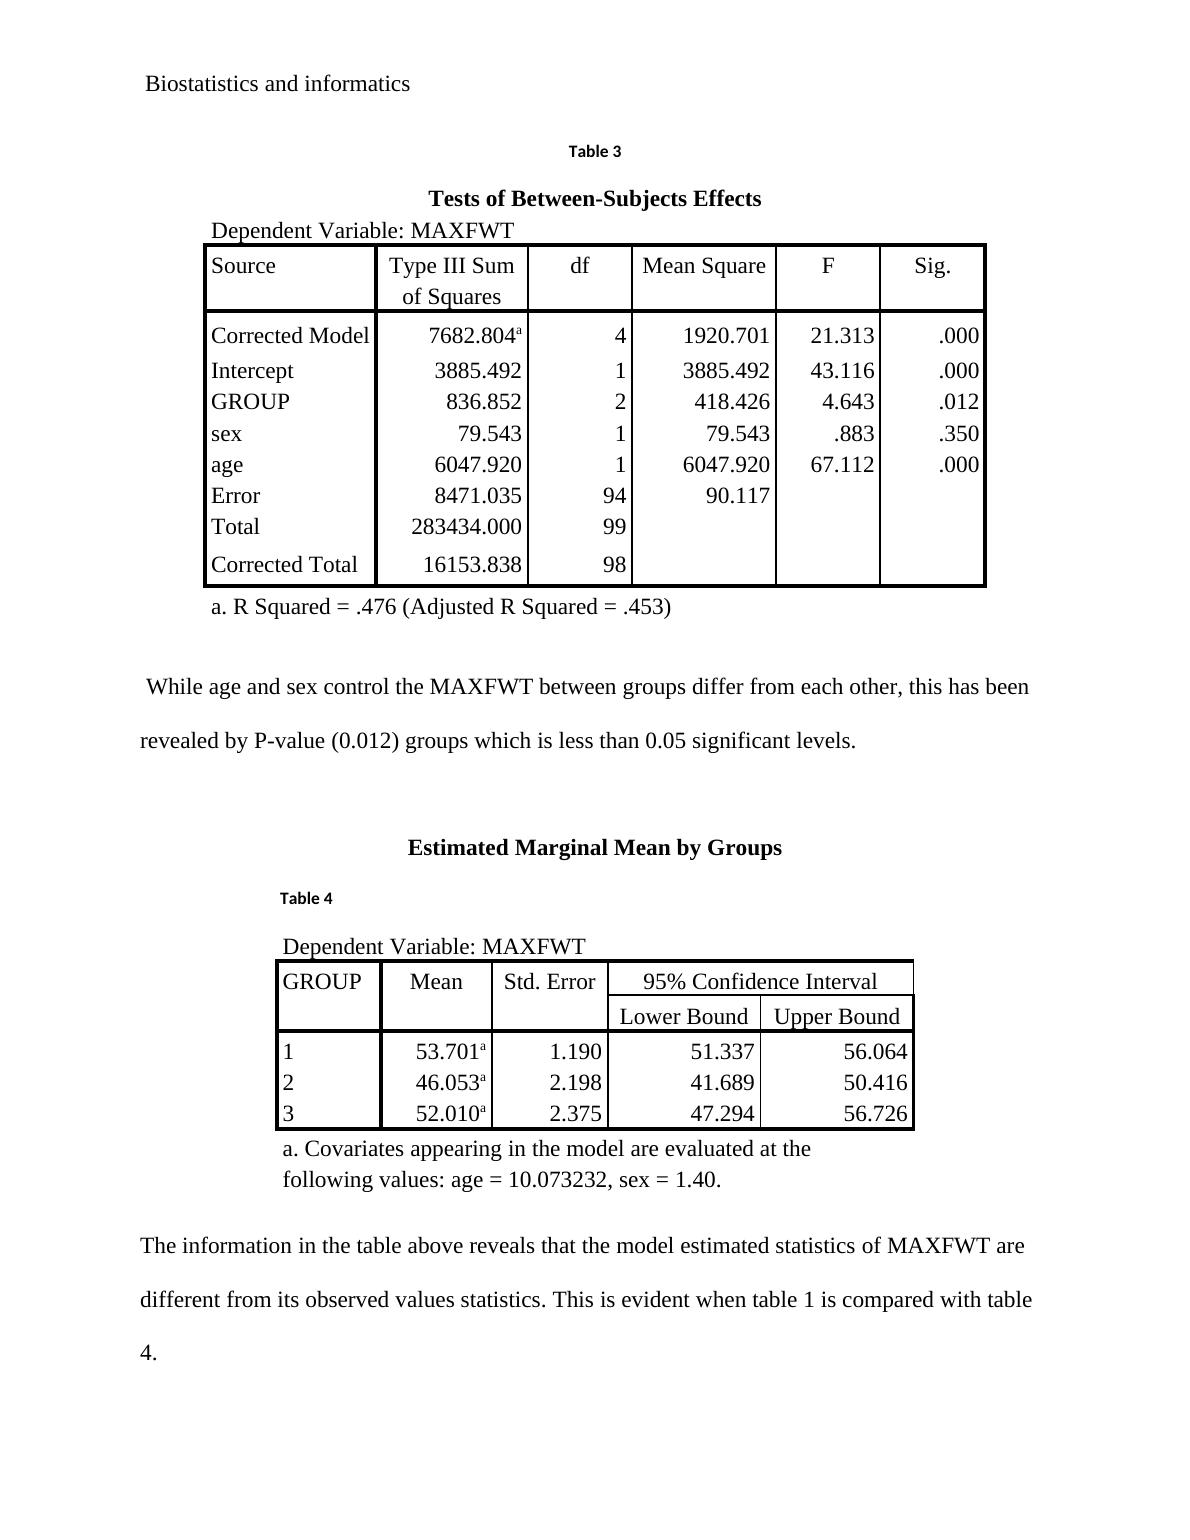
Biostatistics and Informatics: ANCOVA Analysis, Odds Ratio, and Association
Added on 2023-06-04
10 Pages1445 Words78 Views

End of preview
Want to access all the pages? Upload your documents or become a member.
Examining the Effectiveness of a Weight-Loss Program
|11
|2317
|467
Statistics Problems Assignment (pdf)
|18
|5401
|13
Mindfulness: Findings, Analysis, and Conclusion
|17
|3008
|58
SPSS Syntax and Output for Univariate and 2-Way ANOVA
|10
|1356
|110
Regression Analysis in SPSS
|16
|1866
|25
MANOVA Project
|6
|897
|312