Data Analysis Report on Surat Temperature
VerifiedAdded on 2023/01/18
|12
|2014
|29
AI Summary
This data analysis report examines the temperature changes in Surat and explores the impact of global warming. The report uses descriptive and inferential statistics to analyze the temperature variations in different months and concludes that there is a consistent increase in temperature due to global warming. The report suggests the need for controlling emissions to reduce damage to the natural environment.
Contribute Materials
Your contribution can guide someone’s learning journey. Share your
documents today.

DATA ANALYSIS REPORT
Secure Best Marks with AI Grader
Need help grading? Try our AI Grader for instant feedback on your assignments.

ABSTRACT
In the current research study data related to the Surat temperature is analysed. Usually, it is
commonly believed by people that it is global warming because of which now temperature get
imbalanced. Means that in 30 years earlier cold temperature was high but now it is very low as
one if not wear woollen clothes then in that case also it can easily handle cold environment.
Thus, in order to gauge such kind of changes inferential and descriptive statistics is used under
which varied months temperature is analysed and significant difference between them. By doing
so it has found out that there is a difference in degree of temperature in winter, summer and rainy
season but that difference is not so big in Surat. Thus, the temperature almost remains same in
Surat in all weather conditions. It is the global warming effect because of which
temperature rises regularly. Hence, it can be said that government need to control emissions of
carbon from factories and vehicles so that damage to the natural environment can be reduced
to the maximum possible extent.

TABLE OF CONTENTS
INTRODUCTION...........................................................................................................................1
Analysis............................................................................................................................................1
Part 1: Descriptive statistics........................................................................................................1
Part 2 : Inferential statistics.........................................................................................................6
JF to MM...........................................................................................................................6
JS to MM...........................................................................................................................7
JS to OD.............................................................................................................................8
JF to OD.............................................................................................................................9
CONCLUSION..............................................................................................................................10
REFERENCES..............................................................................................................................11

INTRODUCTION
In the current research report main area of topic is to identify whether global
warming affects climatic conditions. It is relevant because we hear that global warming
affect temperature, but no one know to what extent? In present research answer of this question
is identified by using the results obtained from descriptive and inferential statistics. By applying
relevant tools entire research is carried out.
Analysis
Part 1: Descriptive statistics
JAN-FEB MAR-MAY JUN-SEP OCT-DEC
Mean 19.2591 Mean 26.0874 Mean 27.2333 Mean 21.8802
Standard
Error 0.06218 Standard
Error 0.05633 Standard
Error 0.02922 Standard
Error 0.05083
Median 19.12 Median 26.03 Median 27.18 Median 21.82
Mode 19.05 Mode 26.02 Mode 27.18 Mode 21.48
Standard
Deviation 0.67259 Standard
Deviation 0.60935 Standard
Deviation 0.31602 Standard
Deviation 0.54983
Sample
Variance 0.45238 Sample
Variance 0.37131 Sample
Variance 0.09987 Sample
Variance 0.30231
Kurtosis 4.64971 Kurtosis 4.39406 Kurtosis 3.25104 Kurtosis 4.06554
Skewness 1.45882 Skewness 1.33793 Skewness 1.18209 Skewness 1.43247
Range 4.67 Range 3.97 Range 1.97 Range 3.25
Minimum 17.58 Minimum 24.89 Minimum 26.53 Minimum 20.96
Maximum 22.25 Maximum 28.86 Maximum 28.5 Maximum 24.21
Sum 2253.31 Sum 3052.22 Sum 3186.3 Sum 2559.98
Count 117 Count 117 Count 117 Count 117
Confidence
Level
(95.0%)
0.12316
Confidence
Level
(95.0%)
0.11158
Confidence
Level
(95.0%)
0.05787
Confidence
Level
(95.0%)
0.10068
From the table given above it can be observed that the mean value of the temperature is 19.25 for
the month of January to February. The standard deviation for same is 0.67 which is quite low and
this reflect that most of time, temperature remains same in each day of the month January and
February. In case of months March, April and May mean temperature is 26.08 degree and
1
Paraphrase This Document
Need a fresh take? Get an instant paraphrase of this document with our AI Paraphraser

standard deviation again is low at 0.60. This reflects that temperature remains same during these
months. From June to September during these three months mean value of the temperature is
27.23 degrees and the standard deviation is 0.31. Finally, from the month of October to
December average temperature is 21.88 and the standard deviation is 0.54. Hence, it can be said
that consistent increase is observed in the temperature other than October, November and
December month because these are winter months in India. Interesting fact is that temperature
decline consistently from October to February. As per facts average temperature from October to
December is 21.88 and from January to February is 19.25. Thus, a temperature
declines consistently during these 5 to 6-month time period. There is interesting fact to see which
that from May to September temperature is almost remain stable at 26.08 to 27.23.
Whereas, temperature from October to February decline consistently in the Surat. There
may be a reason behind such kind of trend and one of them is pollution. In Surat in the past
year's number of vehicles increase at a rapid pace and they emit large quantity of pollutants
(Praneetham and Thathong, 2016). Emission of gas from bikes and cars lead to an elevation in
the temperature and due to this reason natural temperature is low but then also it will elevate
because of hot environment developed by the gas emitted from the cars and bikes.
Part 2 : Inferential statistics
Table 1Jan Feb CI
Mean 19.25
STDEV 0.67
Sample size 117
DF 116
Confidence level 95%
Alpha 0.025
Look at alpha and DF value in t table 0.0674
STDEV/SQRT(Sample size) 0.061942
T table value* (STDEV/SQRT(Sample
size)) 0.004175
Lower level 19.24583
Upper level 19.25417
2
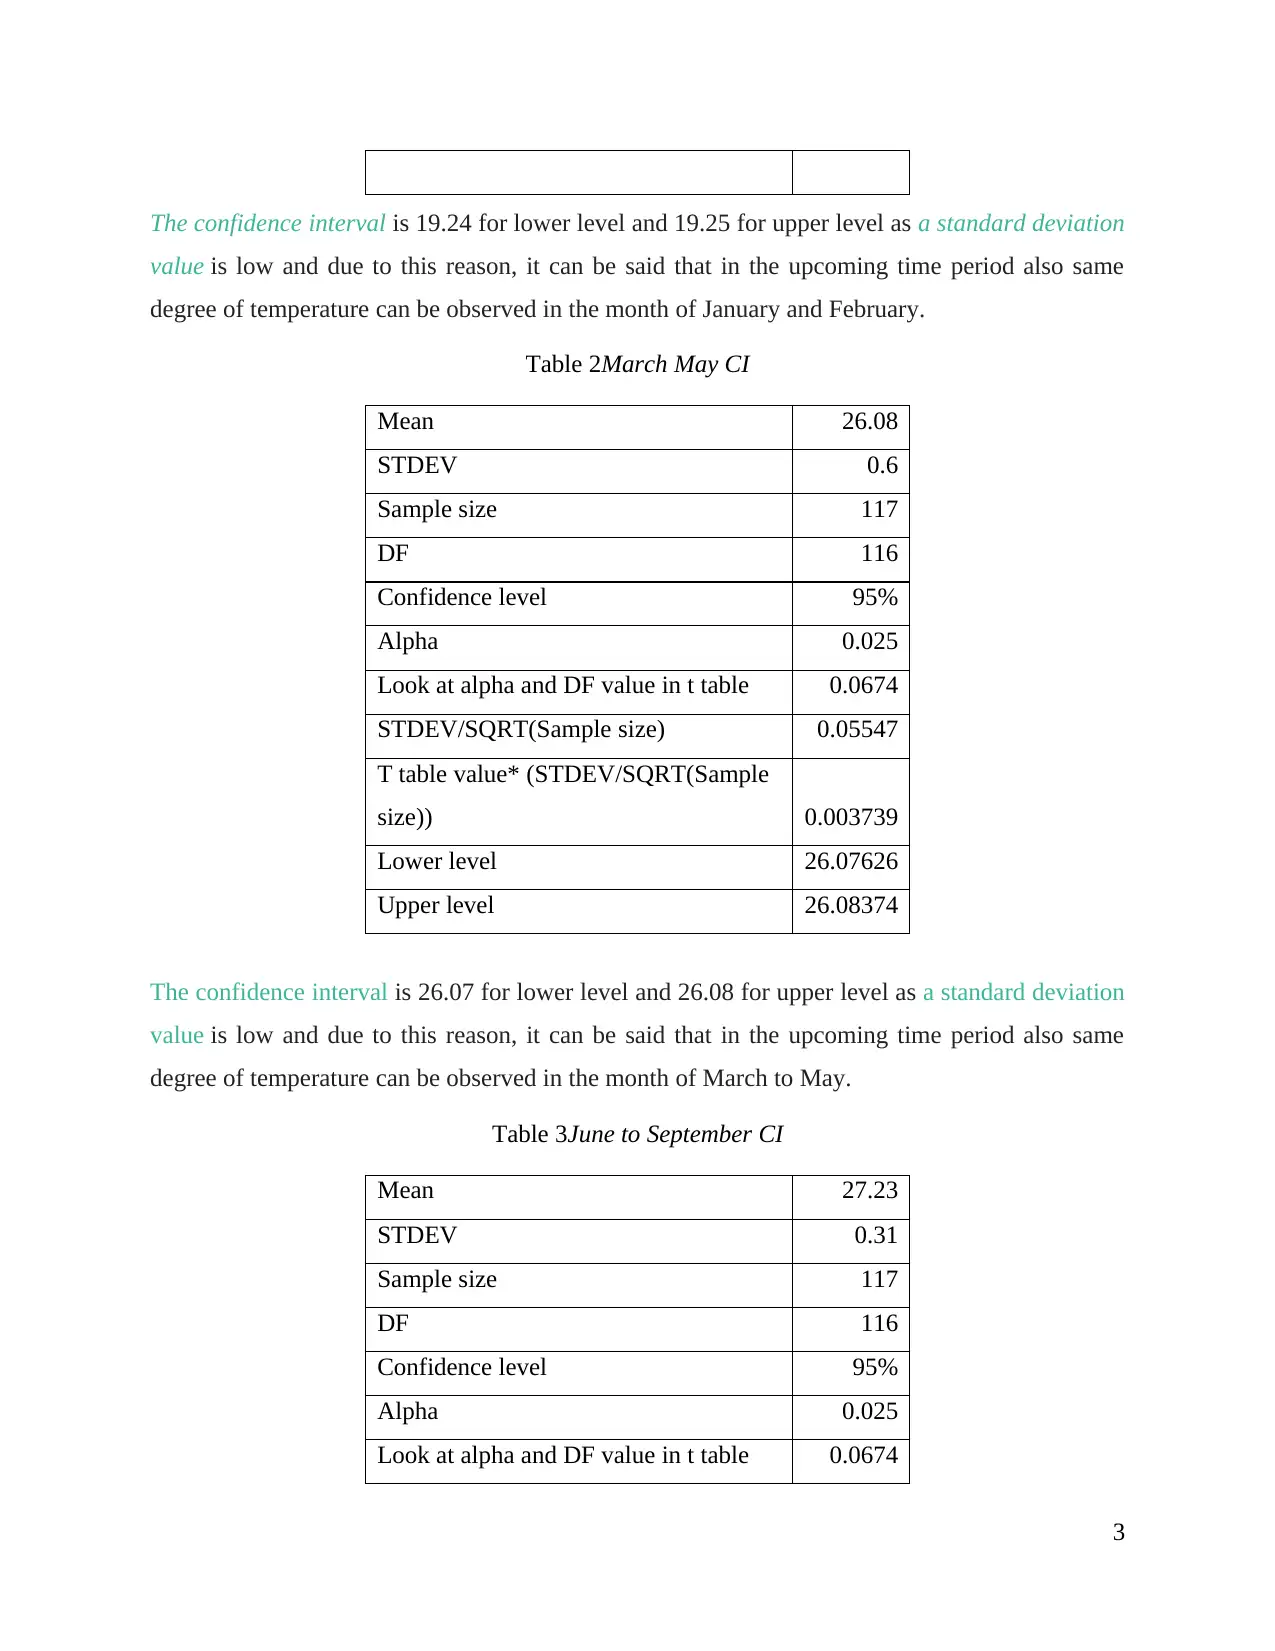
The confidence interval is 19.24 for lower level and 19.25 for upper level as a standard deviation
value is low and due to this reason, it can be said that in the upcoming time period also same
degree of temperature can be observed in the month of January and February.
Table 2March May CI
Mean 26.08
STDEV 0.6
Sample size 117
DF 116
Confidence level 95%
Alpha 0.025
Look at alpha and DF value in t table 0.0674
STDEV/SQRT(Sample size) 0.05547
T table value* (STDEV/SQRT(Sample
size)) 0.003739
Lower level 26.07626
Upper level 26.08374
The confidence interval is 26.07 for lower level and 26.08 for upper level as a standard deviation
value is low and due to this reason, it can be said that in the upcoming time period also same
degree of temperature can be observed in the month of March to May.
Table 3June to September CI
Mean 27.23
STDEV 0.31
Sample size 117
DF 116
Confidence level 95%
Alpha 0.025
Look at alpha and DF value in t table 0.0674
3
value is low and due to this reason, it can be said that in the upcoming time period also same
degree of temperature can be observed in the month of January and February.
Table 2March May CI
Mean 26.08
STDEV 0.6
Sample size 117
DF 116
Confidence level 95%
Alpha 0.025
Look at alpha and DF value in t table 0.0674
STDEV/SQRT(Sample size) 0.05547
T table value* (STDEV/SQRT(Sample
size)) 0.003739
Lower level 26.07626
Upper level 26.08374
The confidence interval is 26.07 for lower level and 26.08 for upper level as a standard deviation
value is low and due to this reason, it can be said that in the upcoming time period also same
degree of temperature can be observed in the month of March to May.
Table 3June to September CI
Mean 27.23
STDEV 0.31
Sample size 117
DF 116
Confidence level 95%
Alpha 0.025
Look at alpha and DF value in t table 0.0674
3
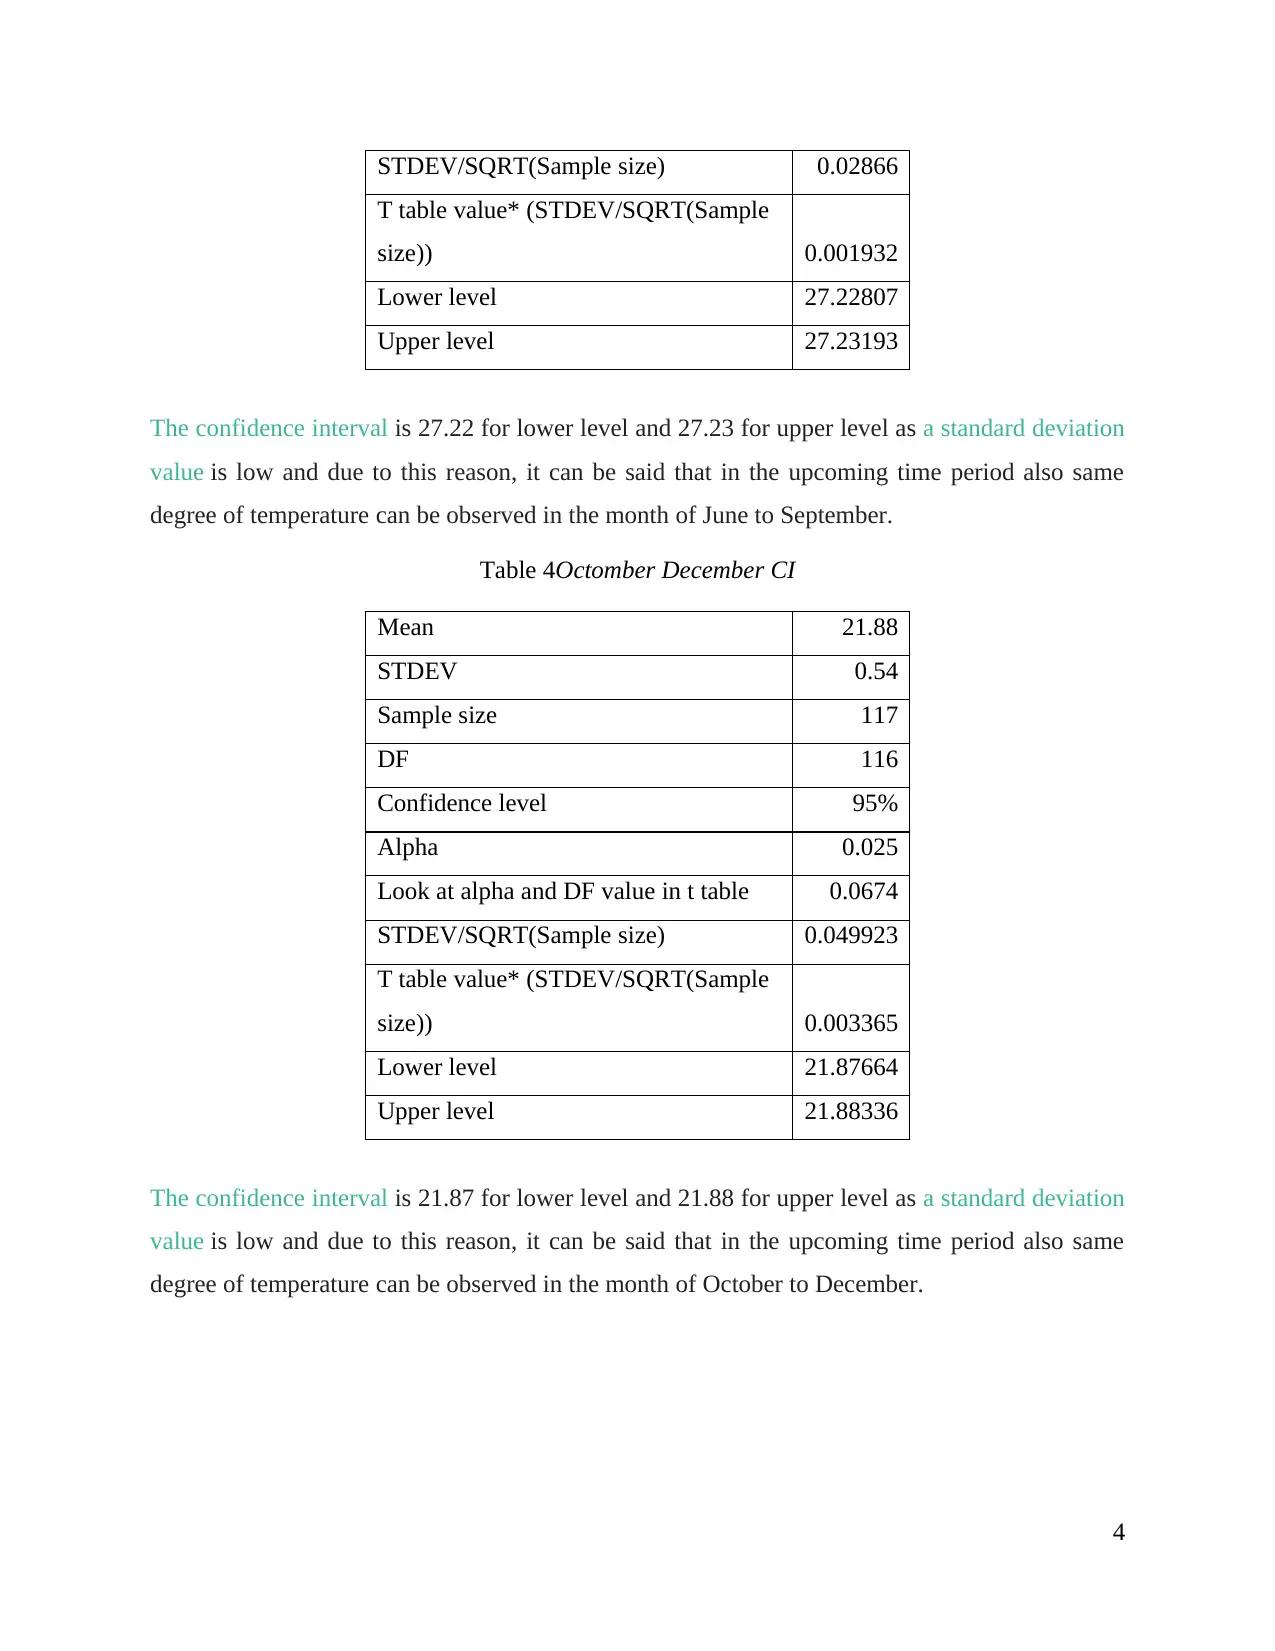
STDEV/SQRT(Sample size) 0.02866
T table value* (STDEV/SQRT(Sample
size)) 0.001932
Lower level 27.22807
Upper level 27.23193
The confidence interval is 27.22 for lower level and 27.23 for upper level as a standard deviation
value is low and due to this reason, it can be said that in the upcoming time period also same
degree of temperature can be observed in the month of June to September.
Table 4Octomber December CI
Mean 21.88
STDEV 0.54
Sample size 117
DF 116
Confidence level 95%
Alpha 0.025
Look at alpha and DF value in t table 0.0674
STDEV/SQRT(Sample size) 0.049923
T table value* (STDEV/SQRT(Sample
size)) 0.003365
Lower level 21.87664
Upper level 21.88336
The confidence interval is 21.87 for lower level and 21.88 for upper level as a standard deviation
value is low and due to this reason, it can be said that in the upcoming time period also same
degree of temperature can be observed in the month of October to December.
4
T table value* (STDEV/SQRT(Sample
size)) 0.001932
Lower level 27.22807
Upper level 27.23193
The confidence interval is 27.22 for lower level and 27.23 for upper level as a standard deviation
value is low and due to this reason, it can be said that in the upcoming time period also same
degree of temperature can be observed in the month of June to September.
Table 4Octomber December CI
Mean 21.88
STDEV 0.54
Sample size 117
DF 116
Confidence level 95%
Alpha 0.025
Look at alpha and DF value in t table 0.0674
STDEV/SQRT(Sample size) 0.049923
T table value* (STDEV/SQRT(Sample
size)) 0.003365
Lower level 21.87664
Upper level 21.88336
The confidence interval is 21.87 for lower level and 21.88 for upper level as a standard deviation
value is low and due to this reason, it can be said that in the upcoming time period also same
degree of temperature can be observed in the month of October to December.
4
Secure Best Marks with AI Grader
Need help grading? Try our AI Grader for instant feedback on your assignments.

JF to MM
H0: There is no significant difference between January and February months and March to May
month.
H1: There is significant difference between January and February months and March to May
month.
t-Test: Two-Sample Assuming Unequal
Variances
JAN-
FEB
MAR-
MAY
Mean 19.25906 26.08735
Variance 0.452381 0.371306
Observations 117 117
Hypothesized Mean Difference 0
df 230
t Stat -81.3812
P(T<=t) one-tail 7.9E-172
t Critical one-tail 1.651506
P(T<=t) two-tail 1.6E-171
t Critical two-tail 1.970332
Results indicate that value of the level of significance is 1.6>0.05 which indicate that there
is no significant difference between January to February month and March to May month. It can
be seen from the table that mean temperature from January to February is 19.25 and the
same from the month of March to May is 26.08. Hence, temperature in later months increase but
not at fast rate.
5

JS to MM
H0: There is no significant difference between June to September months and March to May
month.
H1: There is significant difference between June to September months and March to May month.
t-Test: Two-Sample Assuming Unequal
Variances
JUN-SEP MAR-MAY
Mean 27.23333333 26.08735043
Variance 0.099868966 0.37130585
Observations 117 117
Hypothesized Mean Difference 0
df 174
t Stat 18.0584319
P(T<=t) one-tail 4.79588E-42
t Critical one-tail 1.653658017
P(T<=t) two-tail 9.59176E-42
t Critical two-tail 1.97369144
Results in the above table reflect that value of the level of significance is 9.59>0.05
which means that there is no significant difference in terms of temperature across months that
comes in a range of June to September and March to May. Mean in case of months June to
September is 27.23 and same in the case of March to May is 26.08. Hence, it is clear that there is
no big difference in temperature across between months that comes in range of June to
September and March to May.
JS to OD
H0: There is no significant difference between June to September months and October to
December month.
H1: There is significant difference between June to September months and October to December
month.
6
t-Test: Two-Sample Assuming Unequal
Variances
JUN-
SEP
OCT-
DEC
Mean 27.23333 21.88017
Variance 0.099869 0.302312
Observations 117 117
Hypothesized Mean Difference 0
df 185
t Stat 91.30458
P(T<=t) one-tail 4.1E-156
t Critical one-tail 1.653132
P(T<=t) two-tail 8.2E-156
t Critical two-tail 1.97287
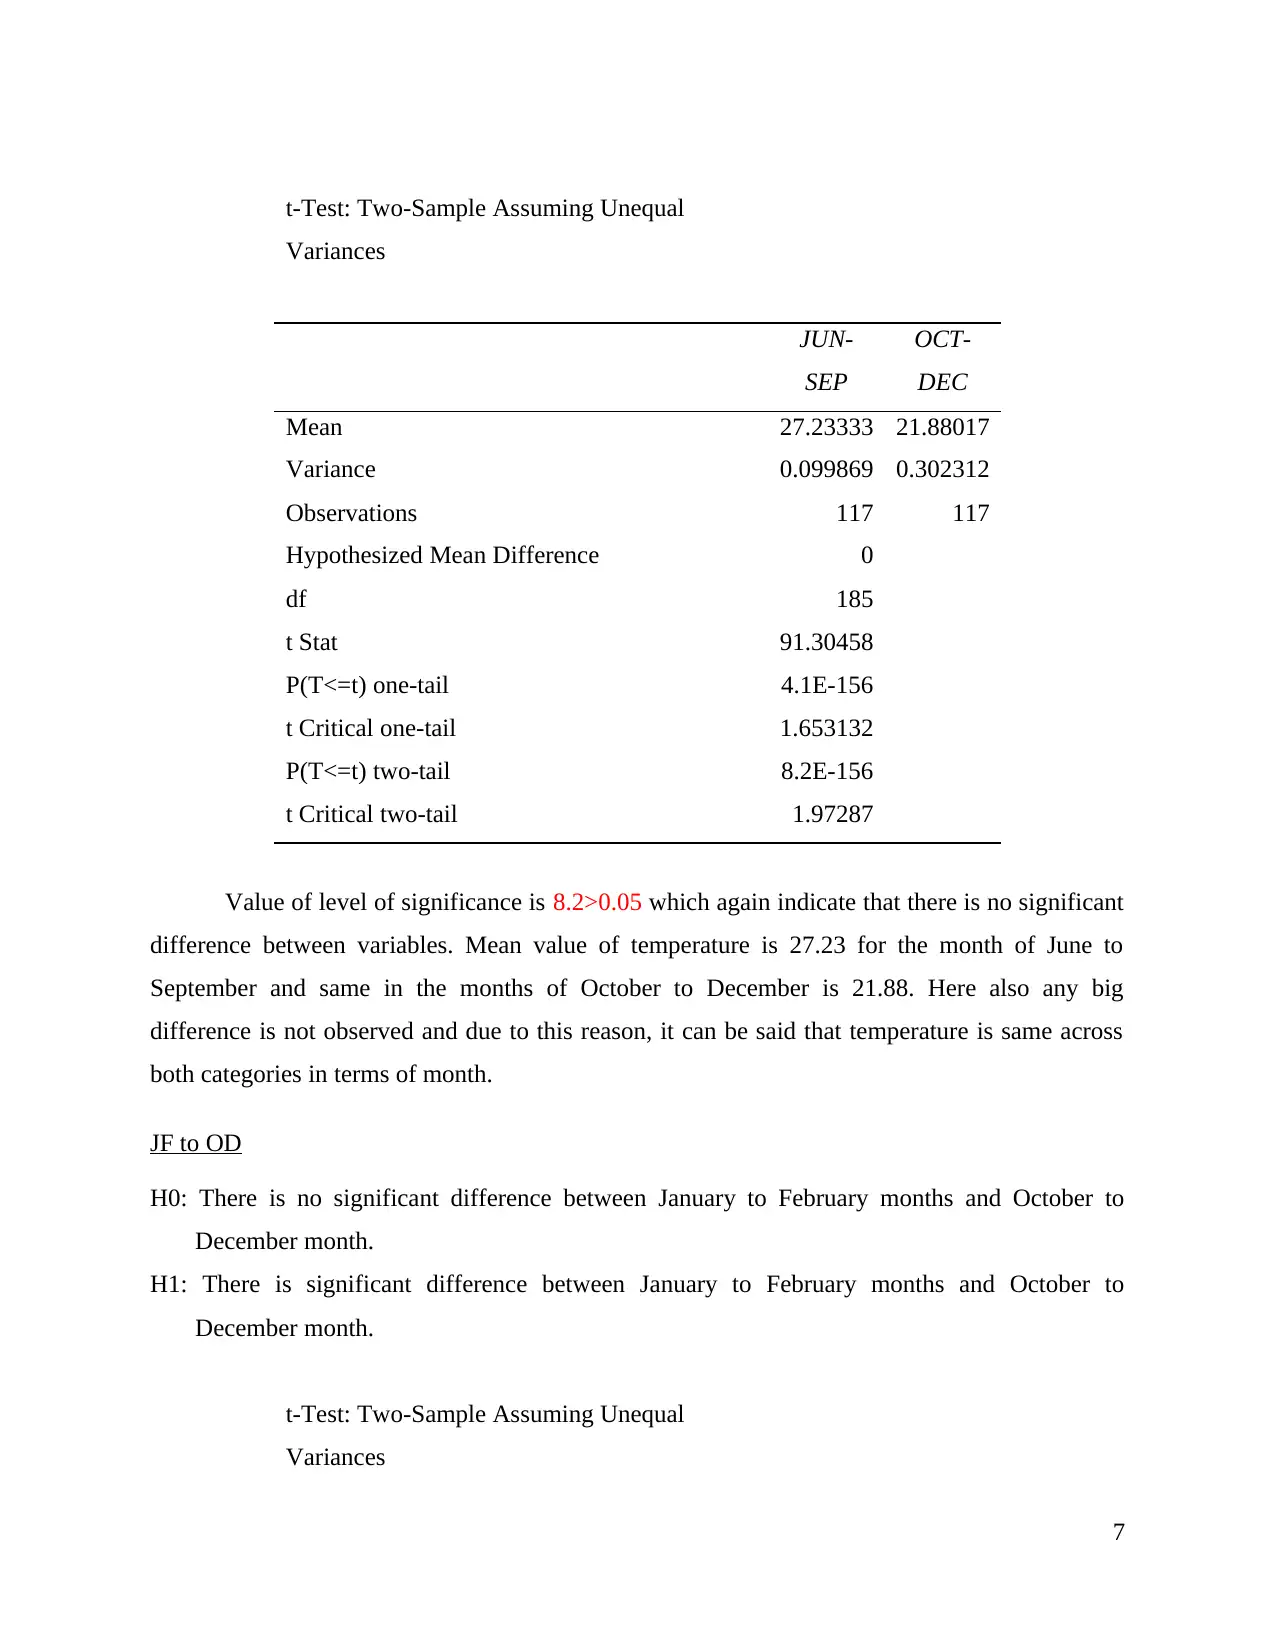
Value of level of significance is 8.2>0.05 which again indicate that there is no significant
difference between variables. Mean value of temperature is 27.23 for the month of June to
September and same in the months of October to December is 21.88. Here also any big
difference is not observed and due to this reason, it can be said that temperature is same across
both categories in terms of month.
JF to OD
H0: There is no significant difference between January to February months and October to
December month.
H1: There is significant difference between January to February months and October to
December month.
t-Test: Two-Sample Assuming Unequal
Variances
7
Variances
JUN-
SEP
OCT-
DEC
Mean 27.23333 21.88017
Variance 0.099869 0.302312
Observations 117 117
Hypothesized Mean Difference 0
df 185
t Stat 91.30458
P(T<=t) one-tail 4.1E-156
t Critical one-tail 1.653132
P(T<=t) two-tail 8.2E-156
t Critical two-tail 1.97287
Value of level of significance is 8.2>0.05 which again indicate that there is no significant
difference between variables. Mean value of temperature is 27.23 for the month of June to
September and same in the months of October to December is 21.88. Here also any big
difference is not observed and due to this reason, it can be said that temperature is same across
both categories in terms of month.
JF to OD
H0: There is no significant difference between January to February months and October to
December month.
H1: There is significant difference between January to February months and October to
December month.
t-Test: Two-Sample Assuming Unequal
Variances
7
Paraphrase This Document
Need a fresh take? Get an instant paraphrase of this document with our AI Paraphraser

JAN-
FEB
OCT-
DEC
Mean 19.25906 21.88017
Variance 0.452381 0.302312
Observations 117 117
Hypothesized Mean Difference 0
df 223
t Stat -32.6357
P(T<=t) one-tail 3.5E-87
t Critical one-tail 1.651715
P(T<=t) two-tail 7E-87
t Critical two-tail 1.970659
In the above table it can be seen that significance value is 7>0.05 which reflect that temperature
is not much different between the months of October to December and January to February.
CONCLUSION
On the basis of the above discussion, it is concluded that temperature in Surat varies from
month to month, but any significant change is not observed in same. Means that in summer
weather very high temperature is not observed and in winter temperature does not become too
cold. Thus, some degree of difference comes in temperature, but any big variation is not
observed in same. It is also concluded that it is global warming effect due to which significant
difference is not observed in temperature across months.
8

REFERENCES
Books and Journals
Praneetham, C. and Thathong, K., 2016. Development of Digital Instruction for Environment for
Global Warming Alleviation. Turkish Online Journal of Educational Technology-
TOJET. 15(2). pp.20-24.
9
Books and Journals
Praneetham, C. and Thathong, K., 2016. Development of Digital Instruction for Environment for
Global Warming Alleviation. Turkish Online Journal of Educational Technology-
TOJET. 15(2). pp.20-24.
9
1 out of 12
Related Documents


Your All-in-One AI-Powered Toolkit for Academic Success.
+13062052269
info@desklib.com
Available 24*7 on WhatsApp / Email
![[object Object]](/_next/static/media/star-bottom.7253800d.svg)
Unlock your academic potential
© 2024 | Zucol Services PVT LTD | All rights reserved.