logo

Impact of Organizational Behavior on Carbon Emission: Data Analysis from Developing Countries

Checklist for data collection and analysis

11 Pages1864 Words368 Views
   

Added on  2023-06-12

About This Document

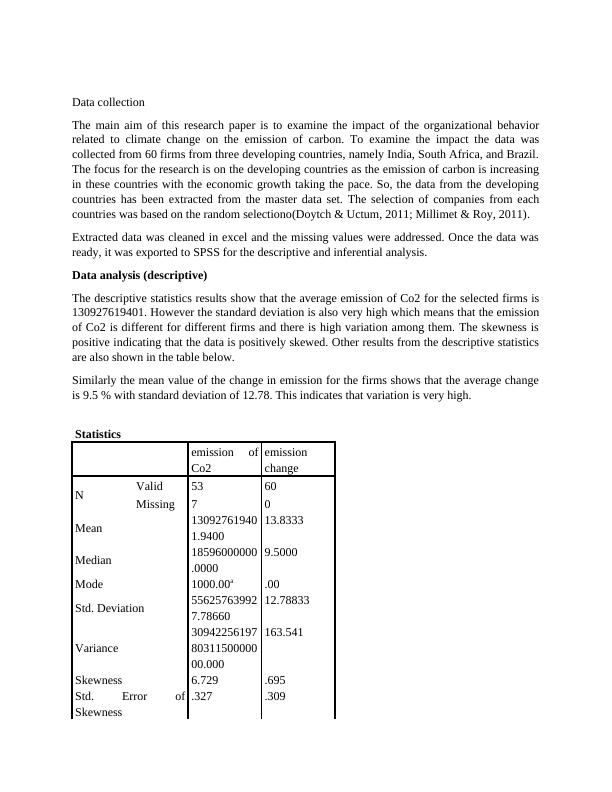
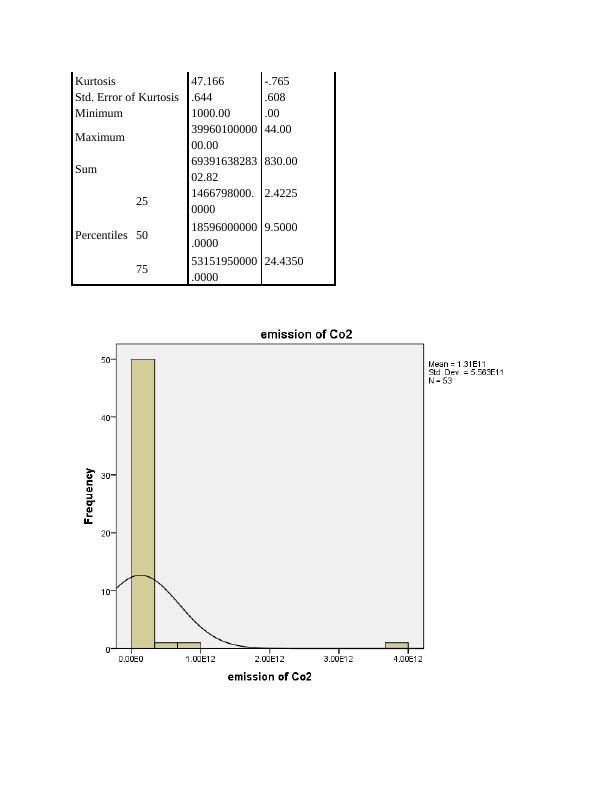
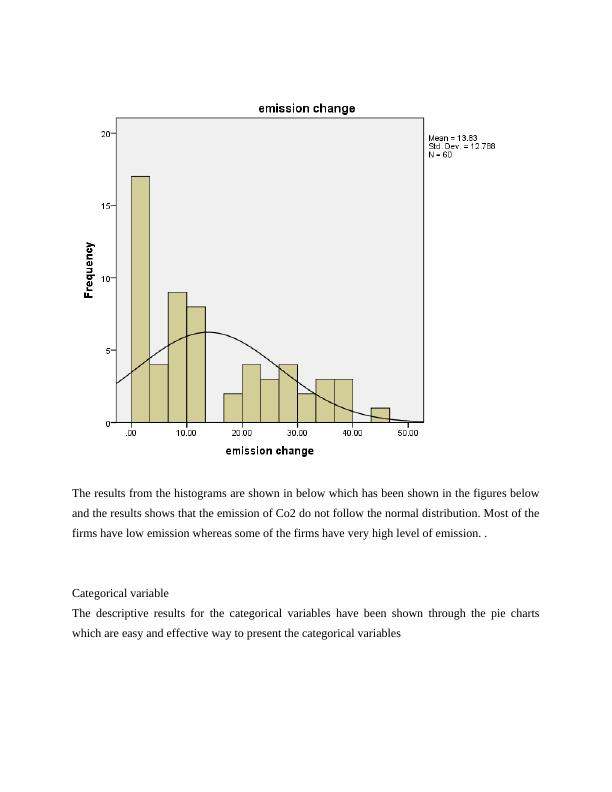
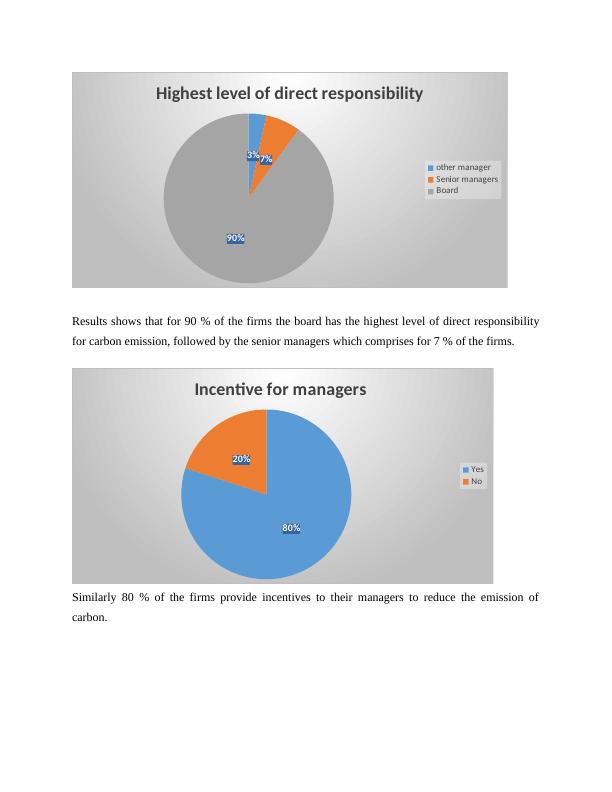
This research paper examines the impact of organizational behavior related to climate change on carbon emission. Data was collected from 60 firms in India, South Africa, and Brazil. Descriptive and inferential analysis was conducted using SPSS. Results show that the average emission of Co2 for the selected firms is 130927619401. The descriptive statistics results show that the average emission of Co2 for the selected firms is 130927619401. The regression analysis shows that all independent variables have a positive impact on the dependent variable, but the coefficients are not statistically significant.

Impact of Organizational Behavior on Carbon Emission: Data Analysis from Developing Countries

Checklist for data collection and analysis

   Added on 2023-06-12

ShareRelated Documents
Data collection
The main aim of this research paper is to examine the impact of the organizational behavior
related to climate change on the emission of carbon. To examine the impact the data was
collected from 60 firms from three developing countries, namely India, South Africa, and Brazil.
The focus for the research is on the developing countries as the emission of carbon is increasing
in these countries with the economic growth taking the pace. So, the data from the developing
countries has been extracted from the master data set. The selection of companies from each
countries was based on the random selectiono(Doytch & Uctum, 2011; Millimet & Roy, 2011).
Extracted data was cleaned in excel and the missing values were addressed. Once the data was
ready, it was exported to SPSS for the descriptive and inferential analysis.
Data analysis (descriptive)
The descriptive statistics results show that the average emission of Co2 for the selected firms is
130927619401. However the standard deviation is also very high which means that the emission
of Co2 is different for different firms and there is high variation among them. The skewness is
positive indicating that the data is positively skewed. Other results from the descriptive statistics
are also shown in the table below.
Similarly the mean value of the change in emission for the firms shows that the average change
is 9.5 % with standard deviation of 12.78. This indicates that variation is very high.
Statistics
emission of
Co2
emission
change
N Valid 53 60
Missing 7 0
Mean 13092761940
1.9400
13.8333
Median 18596000000
.0000
9.5000
Mode 1000.00a .00
Std. Deviation 55625763992
7.78660
12.78833
Variance
30942256197
80311500000
00.000
163.541
Skewness 6.729 .695
Std. Error of
Skewness
.327 .309
Impact of Organizational Behavior on Carbon Emission: Data Analysis from Developing Countries_1
Kurtosis 47.166 -.765
Std. Error of Kurtosis .644 .608
Minimum 1000.00 .00
Maximum 39960100000
00.00
44.00
Sum 69391638283
02.82
830.00
Percentiles
25 1466798000.
0000
2.4225
50 18596000000
.0000
9.5000
75 53151950000
.0000
24.4350
Impact of Organizational Behavior on Carbon Emission: Data Analysis from Developing Countries_2
The results from the histograms are shown in below which has been shown in the figures below
and the results shows that the emission of Co2 do not follow the normal distribution. Most of the
firms have low emission whereas some of the firms have very high level of emission. .
Categorical variable
The descriptive results for the categorical variables have been shown through the pie charts
which are easy and effective way to present the categorical variables
Impact of Organizational Behavior on Carbon Emission: Data Analysis from Developing Countries_3
3%7%
90%
Highest level of direct responsibility
other manager
Senior managers
Board
Results shows that for 90 % of the firms the board has the highest level of direct responsibility
for carbon emission, followed by the senior managers which comprises for 7 % of the firms.
80%
20%
Incentive for managers
Yes
No
Similarly 80 % of the firms provide incentives to their managers to reduce the emission of
carbon.
Impact of Organizational Behavior on Carbon Emission: Data Analysis from Developing Countries_4

End of preview

Want to access all the pages? Upload your documents or become a member.

Related Documents
Data collection Assignment PDF
|8
|1681
|100

SPSS Data Collection - Assignment
|11
|1734
|19

Data Collection and Descriptive Analysis of Coca Cola's Carbon Emission Data from 2011-2017
|13
|1877
|456

Frequencies and T-Test Analysis for Climate Change Management Incentives
|9
|564
|401

Analysis of Carbon Emissions Data for Companies in Australia, Belgium, and Brazil in 2012
|11
|1957
|333

Statistics of the Data Assignment
|6
|1003
|125