The Latino Engineering Company
VerifiedAdded on 2020/03/16
|13
|3587
|122
AI Summary
Project Management Methodologies Introduction 3 Identifying Causes and Continuous Improvement Plan 3 Continuous Improvement Plan (CIP) 6 The Cause and Effect Diagram 6 A Check Sheet 6 Control Charts7 Histogram Analysis 7 Pareto Chart 7 Scatter Diagram 8 Stratification Methods 8 Continuous Quality Improvement 9 Conclusion 9 References 10 Introduction The Latino Engineering Company, founded 30 years back by a passionate engineer who believes in quality, Dominic Latino, is facing serious challenges after being sold off to a consortium of investors.
Contribute Materials
Your contribution can guide someone’s learning journey. Share your
documents today.
Project Management Methodologies
Secure Best Marks with AI Grader
Need help grading? Try our AI Grader for instant feedback on your assignments.
Table of Contents
Introduction....................................................................................................................................................3
Identifying Causes and Continuous Improvement Plan............................................................................3
Continuous Improvement Plan (CIP).............................................................................................................6
The Cause and Effect Diagram.................................................................................................................6
A Check Sheet...........................................................................................................................................6
Control Charts...........................................................................................................................................7
Histogram Analysis...................................................................................................................................7
Pareto Chart..............................................................................................................................................7
Scatter Diagram........................................................................................................................................8
Stratification..............................................................................................................................................8
Continuous Quality Improvement..................................................................................................................9
Conclusion.....................................................................................................................................................9
References....................................................................................................................................................10
Introduction
The Latino Engineering Company, founded 30 years back by a passionate engineer who believes
in quality, Dominic Latino, is facing serious challenges after being sold off to a consortium of
investors. Earlier, they had given Mr. Latino the offer of buying shares; but the latter believed
this would affect his control over the firm and adversely impact his decision making. As a result,
Mr. Latino decided to sell the whole company and retire. The new owners retained the previous
employees, although lost some managers that left to seek greener pastures. Latino Engineering
had develop a huge customer base and high sales, mainly because of its reputation for quality,
supplying engineering equipment to various companies in diverse industries including services,
construction, gas and oil, and infrastructure projects. Unfortunately, the last twelve months have
seen complaints rise from customers; the complaints include;
i. Defective engineering equipment
ii. Poor design and development follow up with clients
iii. Too long turnaround time for issue resolution
iv. Non responsive customer service team
v. In some cases, wrong engineering equipment was packaged and delivered to clients
Latino Engineering has therefore asked for solutions on how these issues can be tackled within a
three month period. This report outlines the tools and methods that will be used to identify the
cause of the problems, along with solutions to the problem, and what will have to be done to
ensure continuous improvement to ensure high quality and resolve the niggling problems. The
main approach will entail the use of the 7 QC Tools in the context of Kanban for continuous
improving; the process will start by an evaluation using the POTI tool.
Identifying Causes and Continuous Improvement Plan
The proposed tool to be used for the CIP (continuous improvement plan) is the Seven Quality
Control Tool for Continuous Improvement (7 QC Tools). The 7 QC Tools method refers to a toll
used in solving problems employing the use of simple statistical methods (Leebov & Ersoz
2003). The 7 QC Tools is a set of predominantly graphical techniques that are very helpful in
identifying and solving most of the quality related issues, for example in manufacturing or
provision of services (Stolfa et al., 2016). It originated in the post war Japan and was inspired by
the seven Benkel weapons and is now listed by the PMBOK as useful tool for controlling and
planning the quality of projects (Oakland 2016). The 7 QC Tools contain seven specific tools
namely;
i. The Cause and Effect Diagram
ii. A Check Sheet
iii. A Control Chart
iv. A Histogram
v. A Pareto Chart
vi. A Scatter Diagram
vii. A Stratification chart
Before implementing methods for improving the processes at Latino Engineering, it is essential
that a wider framework is employed in identifying the issues causing the reported problems. The
problems at Latino Engineering are systemic, with the reported issues being symptoms of a much
bigger malaise, including poor communication and an organizational culture that is not aligned
with the traditional strategic goals and objectives of Latino Engineering. To start off, the POTI
Model (that means Processes, Organization, and Technology & Information) is a tool used by
organizations to develop a blue print of its vision. Processes refer to a chain of activities; this
project aims at changing some processes at Latino and introduces new ones in order to improve
customer service and quality (Cox 2014), (Bartolini and Gaspary, 2009). It is envisaged that
some business models at Latino must be changed after this project is implemented. The changes
allude to output and levels of performance, introducing new ways of dealing with clients and
designing, phasing out old approaches presently in use, and changing present working methods
(Vijaykumar 2015). Latino will need to have the customer service personnel re trained so they
can better meet client needs. A meeting will be held with them and their opinions on ways of
making improvements sought before changes are implemented.
Changes are also required in how engineers and designers deal with clients, from capturing
customer needs, to sourcing raw materials and designing and testing the products. Upon making
a request, a project team with the requisite skills will be assigned to the client. The team will
collect the needs of the customer and then meet and decide on how they can deliver the product
to the client as required. These teams will have specified roles and will report their progress
Secure Best Marks with AI Grader
Need help grading? Try our AI Grader for instant feedback on your assignments.
periodically to the manager, special projects. The teams will work with computers and require
software to aid their work, including design and design management software and testing and
simulation software, along with software for collaboration to enhance team work, fast delivery,
and reduced defects in products. The team will, after designing the product, undertake extensive
tests in a simulated environment using suitable testing software. After extensive tests, the team
will review results based on design and performance requirements and make adjustments to the
design and carry out more tests until the design meets functional and performance specifications.
This is to be followed by the design of a prototype and testing I in real conditions, before making
adjustments and building the final product. In all instances, there must be recorded
communication with the client or their representatives, captured through an application like
customer relationship management software (CRM)(Peratec 2012). The team will have a
designated project manager to ensure the customer requirements are fully met within the
provided time and budget and take notes for further review. The teams handling a project must
have a comprehensive report upon completion and have this given to the Latino Engineering
Management.
Organization alludes to the changes people must undergo in order to improve service delivery
and product quality, including changing the organizational culture at Latino. The aspect deals
with new skills required for employees, levels of staffing, changes in organizational culture, and
training. The problems indicate that the organizational culture at Latino is wanting and changes
must be undertaken. This will require managers to be involved in initiating cultural changes and
have a culture that is centered on customer delivery and quality(Hewett n.d).
Technology refers to the requirements for technology at Latino so that operations and processes
can be improved to better reflect customer needs. Technology entails new computer systems,
changing present systems of technology, networking requirements, and information systems. The
operations at Latino, from the problems described, require automated processes with tracking
and reporting so that those in charge of projects can be identified and how they handle the project
be recorded too. Further, it will enhance customer delivery and service by enabling customer
complaints to be recorded, and assigned to a customer service person, and follow up done
(Vijaykumar 2015).
Information alludes to data; companies are increasingly relying on data for decision making and
strategy development. As such, Latino will need to have systems that generate reports in real
time that are then used for decision making.
As with all projects, this one has some inherent risks as well as assumptions. Risks will be
managed through a risk management and mitigation plan that will take into consideration the
assumptions to the project and define certain and uncertain events. With this information, a plan
and schedule will be created for managing project risks (Artto & Kahkonen 2013). The risk
management approach will be continuous, with new risks identified and mitigation measures put
in place. This project works on the assumption that Latino has the resources to acquire the
necessary software and expertise to aid in project implementation. It is also assumed that there
will be full cooperation from staff and the project executive and business sponsors will ensure
the project has no barriers or internal threats, including financing (Miller & Lessard 2001).
Continuous Improvement Plan (CIP)
The plan, as discussed afore, will employ the 7 QC Tools
The Cause and Effect Diagram
This is a quality tool that is useful in showing the relationship between the effect and the
observed ‘symptoms’. This tool will be employed in generating ideas about the causes of the
problems currently being experienced by Latino Engineering. The ideas will seek to know the
causes of the listed problems especially on engineering products quality and customer service.
This will start by a question on why products are defective, and customer support is
unresponsive? The question for each problem must be answered by the generated ideas. Ideas
can include causes like machinery, methods used, measurements, materials, and human resources
(Holcomb 2001). The branches of the diagram are then labeled and brainstorming initiated to
find the cause for each and every category (As depicted in Fig I). the causes will then be
prioritized and validated.
A Check Sheet
This is a structured form for data collection and will be used for collecting observed data, such as
defects in products and the team/ department/ people in charge of producing a specific product.
The pattens and frequency of product defects, unresponsive customer service, and poor follow up
during design and development to establish events, their frequency, patterns, causes, of defects,
and the location of these defects. The check sheets will be populated by first determining the
issue to be observed and a decision made on when to collect data. The form will then be designed
and data recorded; this will help identify where the problems are coming from and their
frequency (Shiba, Walden, Graham & Petrolini 2007).
Control Charts
These will be utilized in studying processes and how they change with time; the charts will have
upper and lower limits for control using historical data. Current data will be used to compare
with historical data and conclusions drawn. The charts will measure variables and variations; for
instance, the relationship between use of a CRM and customer satisfaction. The control charts
will be applied to control the processes of design, customer service, and product development
and be used for predicting the expected outcomes range within a process. Using statistical
control methods, the control charts will be used to determine whether the current processes are
stable and remedial measures proposed. Further, the control charts will be used to analyze
process variation patterns due to special causes that are not routine as well as those due to
common causes built into processes (Shiba, Walden, Graham & Petrolini 2007). The control
charts will also help Latino Engineering determine if programs for improving quality should
focus on preventing/ managing specific problems or have the entire process changed. The charts
will be used for collecting data, constructing charts and analyzing data.
Histogram Analysis
This is a frequency distribution tool that will be used to show how often different values are
observed; for instance, how often a particular defect is observed within a given product batch.
The histogram shows the data distribution shape for issues with numerical data, such as number
of times a product performance is simulated and the resultant defects (Revelle 2004). The
histogram will also be used to evaluate the chances of a given process resulting in customer
needs being met and to determine the periods during which process changes have occurred. The
histogram will additionally be helpful in determining whether there is difference between two or
more processes have and to quickly communicate data distribution points. The histogram
requires at least fifty consecutive data points to be collected.
Paraphrase This Document
Need a fresh take? Get an instant paraphrase of this document with our AI Paraphraser
Pareto Chart
This is also a frequency chart where bar lengths denote the frequency of occurrence; for the
Latino Engineering Company. The Pareto chart will be used to define those issues that are of
critical importance in terms of frequency and impact. This will help in focusing on effort on the
most important issues that, for example, adversely impact product quality (Vrat 2014). It will
give an indication of the observed problems frequency and their causes. The chart will also help
determine the causes that focus should be placed on, especially if there are many causes
identified by the cause and effect diagram. The chart will also help in understanding broad
causes of problems by enabling specific components to be evaluated and it will also help in
communicating data to different stakeholders within the company.
Scatter Diagram
According to Protzman et al. (2016), the scatter diagram is an X-Y graph plotted on a Cartesian
plane and it pairs numerical data that are variables, with each axis representing a given variable.
It aims at establishing correlation between two variables and help make predictors on what
happens to one variable when the other changes. This is especially important for improving
processes and products quality as it will determine if variables are correlated such as when
identifying the root causes of the problems, determine the objectivity of the cause –effect
diagram findings, and for testing for auto correlation before a control chart is constructed
('American Society for Quality', 2017).
Stratification
This will be used together with other tools after various data have been lumped together; it
ensures meanings for such lumped data can still be seen. The stratification tool ensures that
patterns remain visible, for instance, the number of defective machines over a given time period.
With such information, the company will be able to determine the progress in quality
improvement, whether things are getting better or worse. Stratification is used even before data is
collected and when analysis of collected data requires different conditions or sources to be
separated ('American Society for Quality', 2017). The tool will also be used when data is
obtained from different conditions and sources such as production schedules for different
departments, or defects for every production shift.

The entire 7 QC tools and how it will be implemented is show in the Appendices
Continuous Quality Improvement
The 7 QC tools will not be applied once; instead; they will provide valuable data to use for
designing improvements and monitor the impacts of those interventions and determine what to
continue using and what to abandon. The 7 QC Tools will also help determine the issues and
causes that are of critical importance and have bigger impacts and help determine resource
allocation on where to start making changes (Dale 2016). The Kanban framework, along with
tools like total quality management (TQM), will be employed to ensure significant
improvements in the listed problems; Kanban is a framework used to improve manufacturing
within the context of lean manufacturing (Novkov, 2017). It will be applied to the entire
production system at Latino Engineering, from controlling inventory, to ensuring quality,
reducing defects, and responding to customer needs. Using Kanban, cycle and lead times for
processes and steps will be measured so that problem areas can be identified, with help from data
and trends from the 7 QC Tools (Radigan 2017). This will be used to ensure continuous
improvement of systems and processes to ensure defects are minimize and customer complaints
reduce or are eliminated. It will be employed in managing and reviewing defects with a view to
eliminating it. Kaizen will also be used to manage the entire process in which data and statistics
are used to monitor performance and progress at the whole company level. Each person is tasked
with ensuring processes and methods are continuously improved using the PDCA model or plan
> do > check > act (Duffy 2014).
Conclusion
Latino Engineering is facing some serious problems to do with product quality and customer
service. To solve them, the root causes must be determined using the POTI framework. Within
this framework, the 7 QC Tools will be employed for identification of problem causes, frequency
monitoring, classification, and evaluation of problems and causes. The 7 QC tools will be helpful
in generating data to determine whether interventions are bearing fruit or no. further, the Kanban
tool will be used in improving quality performance in the company, while Kaizen will be
employed to ensure the processes are repeated with a view to filtering out and eliminating
problems and their causes at every cycle, until high quality levels are obtained, such as 3 defects
per 1000 products.

Secure Best Marks with AI Grader
Need help grading? Try our AI Grader for instant feedback on your assignments.
References
'American Society for Quality' (2017). Stratification - Stratified Analysis | ASQ. [online] Asq.org.
Available at: http://asq.org/learn-about-quality/data-collection-analysis-tools/overview/
stratification.html [Accessed 5 Oct. 2017].
Artto, K. A., & Kahkonen, K. (2013). Managing Risks in Projects. Hoboken, Taylor and Francis.
http://www.123library.org/book_details/?id=63563.
Bartolini, C. and Gaspary, L. (2009). Integrated management of systems, services, processes and
people in IT. Berlin: Springer.
Cox, S. (2014). Managing information in organizations: a practical guide to implementing an
information management strategy. Hampshire ; New York : Palgrave Macmillan
Dale, B. (2016). Managing Quality : An Essential Guide and Resource Gateway. Wiley & Sons
Canada, Limited, John.
Duffy, G. (2014). Modular kaizen. Milwaukee, WI: ASQ Quality Press.
Hewett, J. (n.d). What is Change Management? [online] Balance Global. Available at:
https://balance-global.com/blog/what-is-change-management/
Holcomb, E. L. (2001). Asking the right questions: techniques for collaboration and school
change. Thousand Oaks, Calif, Corwin Press.
Leebov, W., & Ersoz, C. J. (2003). The health care manager's guide to continuous quality
improvement. New York, Authors Choice Press.
Miller, R., & Lessard, D. (2001). Understanding and managing risks in large engineering
projects. International Journal of Project Management. 19, 437-443.
Novkov, A. (2017). Quality Contol vs Continuous Improvement | Kanbanize Blog. [online]
Kanbanize Blog. Available at: https://kanbanize.com/blog/difference-between-quality-control-
and-continuous-improvement/ [Accessed 5 Oct. 2017].
Oakland, J. S. (2016). Total quality management: a pictorial guide for managers. New York,
Routledge.
Protzman, C., Whiton, F., Kerpchar, J., Lewandowski, C., Stenberg, S. and Grounds, P. (2016).
The Lean Practitioner's Field Book. 2nd ed. Boca Raton: Taylor and Francis.
Radigan, D. (2017). Kanban The Agile Coach. [online] Atlassian. Available at:
https://www.atlassian.com/agile/kanban [Accessed 5 Oct. 2017].
Revelle, J. B. (2004). Quality essentials: a reference guide from A to Z. Milwaukee, Wisc, ASQ
Quality Press.
Shiba, S., Walden, D., Graham, A., & Petrolini, J. (2007). Four Practical Revolutions in
Management: Systems for Creating Unique Organizational Capability. Florence, Productivity
Press. http://www.books24x7.com/marc.asp?bookid=4423.
Stolfa, J., Stolfa, S., O'Connor, R. and Messnarz, R. (2016). Systems, software and services
process improvement. Berlin: Springer, p.472.
Vijayakumar, V. (2015). Blueprint - MSP Perspective and General Techniques. [online]
Mspblueprint.blogspot.co.ke. Available at: http://mspblueprint.blogspot.co.ke/ [Accessed 3 Oct.
2017].
Vrat, P. (2014). Materials management: an integrated systems approach. New Delhi : Springer
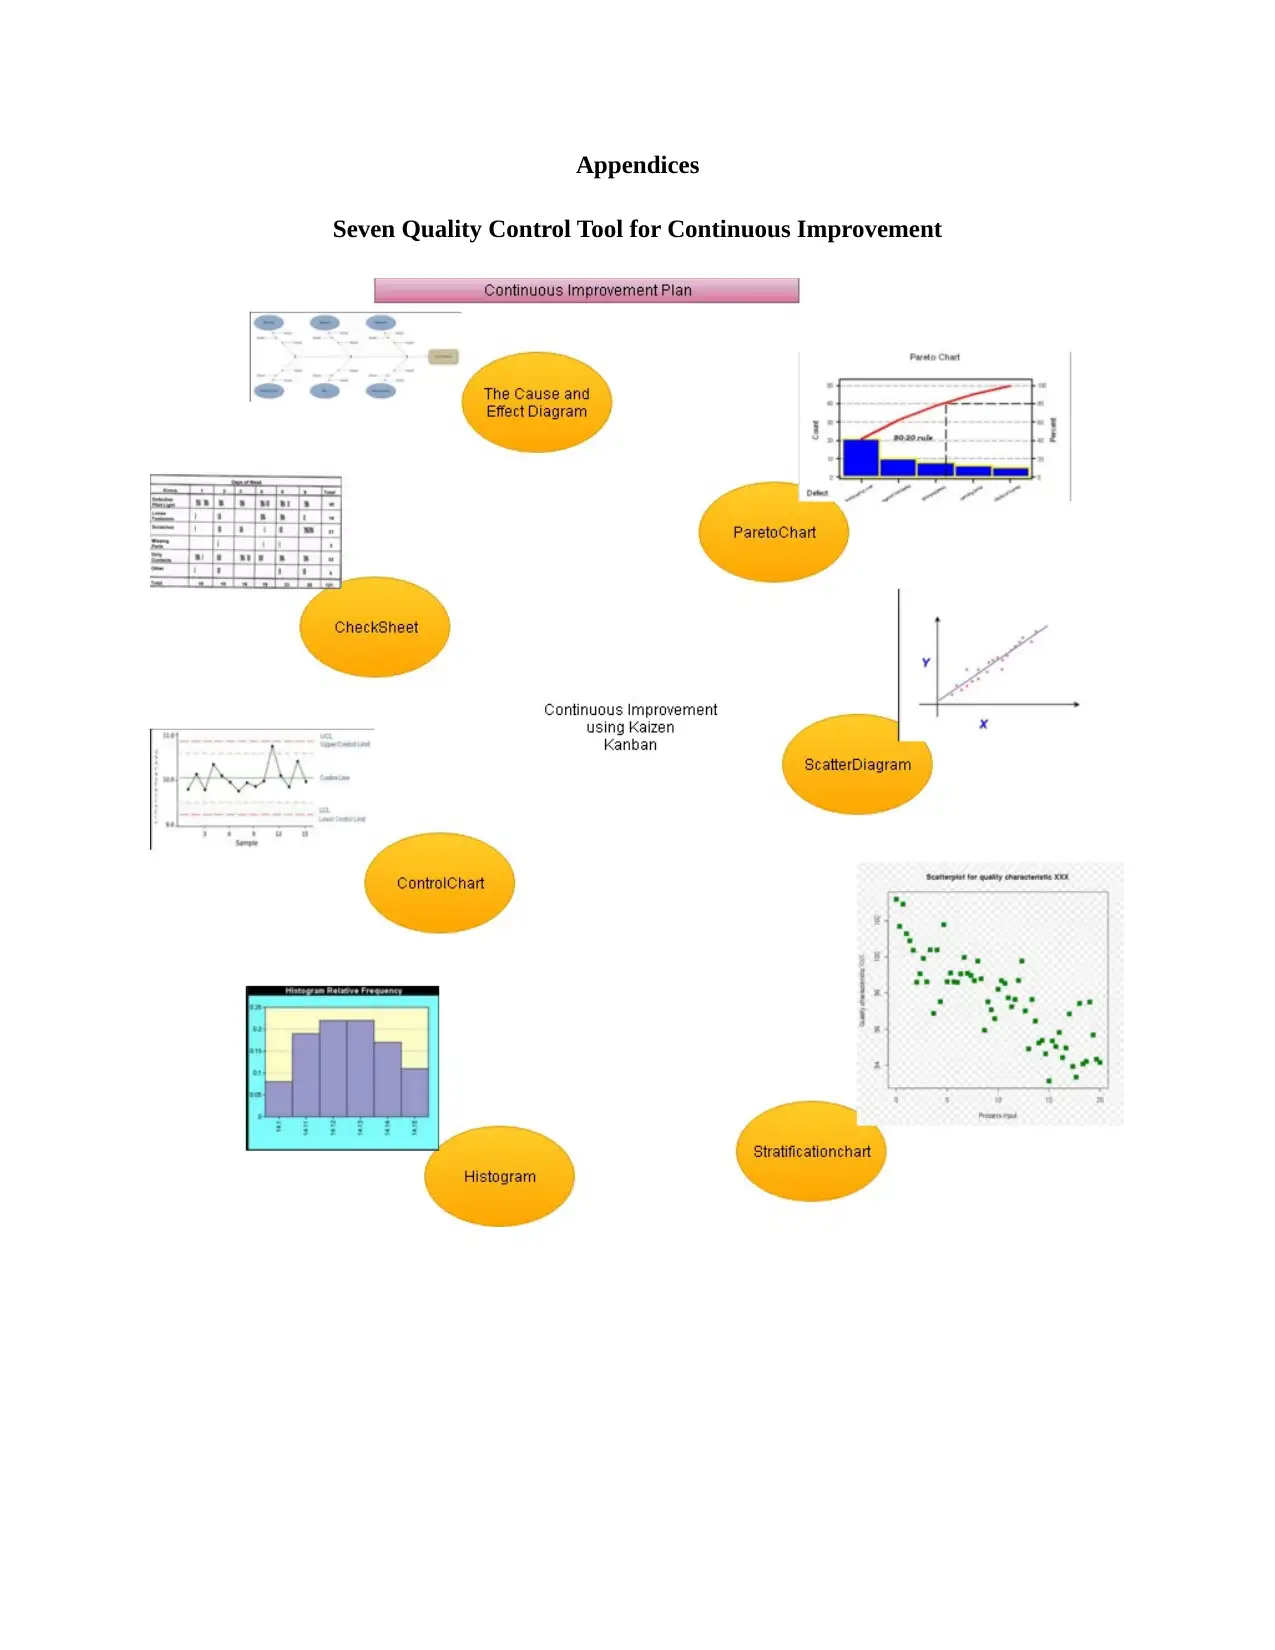
Appendices
Seven Quality Control Tool for Continuous Improvement
Seven Quality Control Tool for Continuous Improvement
1 out of 13
Related Documents


Your All-in-One AI-Powered Toolkit for Academic Success.
+13062052269
info@desklib.com
Available 24*7 on WhatsApp / Email
![[object Object]](/_next/static/media/star-bottom.7253800d.svg)
Unlock your academic potential
© 2024 | Zucol Services PVT LTD | All rights reserved.