Statistics and Data Analysis: Statistical Modelling Assignment
VerifiedAdded on 2023/04/25
|8
|1527
|291
AI Summary
This assignment focuses on applying data collecting and analyzing skills to solve problems in business setup. It includes analysis of single variable in dataset 1, analysis of dataset 1 variable, collection and analysis of dataset 2, and discussion and conclusion.
Contribute Materials
Your contribution can guide someone’s learning journey. Share your
documents today.
Statistics and Data Analysis
STATISTICAL MODELLING ASSIGNMENT
Student name
BUS708 Statistics and Data Analysis
Lecturer name
Institution
State
Date of Submission
STATISTICAL MODELLING ASSIGNMENT
Student name
BUS708 Statistics and Data Analysis
Lecturer name
Institution
State
Date of Submission
Secure Best Marks with AI Grader
Need help grading? Try our AI Grader for instant feedback on your assignments.
Statistics and Data Analysis
1. Section 1: Introduction
a. Introduction
Before success can be achieved in a business there are a lot of risks that the investors
have to take. Mitigation of this risks demand a lot of thinking and intuitions if a well-
informed decision is to be reached that can guarantee future success. Historically
enterprises decision making was largely based in intuitions and experience, but with
emergence of better techniques decision making basis is being transformed to a more
analysis oriented rather than mere institutions (Singh 2018).
Big data have strengthened the roots of business and can be graded as one of the major
revelations for enterprises. In the present business set up before the managers can
develop marketing strategies a lot of analysis is put on the customers behaviour. This is
different from the past where only feedback from the customers could be used to
analyse their needs. Thanks to big data the consumers can now be understood more
clearly allowing the managers room to make more accurate decisions
In this assignment the focus will be on applying the data collecting and analysing skills to
solve problems in business set up. This way it’s expected to present an opportunity to
put the theories acquired during learning into practice.
b. Dataset 1
The dataset 1 has been extracted from the Australian government open data on
international flights operating to and from Australia. Being that the data has been
collected and documented it is thus referred as a secondary data. The data involved a
number of variables of concern to the assignment being “all flights” that is the total
number of airlines in or out of Australia in a given month. Also, the data contain the
name of the airlines and the Australian city where the planes lands or flies out from. This
study case focuses on the Australian airline sector.
c. Dataset 2
The dataset 2 was collected through the use of questionnaires. A total of 80 students
from KOI were supplied with questionnaires which they filled and the information used
to record the data. Being that the sampled population was small it may not represent
the actual population effectively hence resulting to in accurate conclusions. Since the
data was collected directly from the field it is classified as primary data. The data is
considered as a group case as it was only focused on the set of KOI students.
2. Section 2: Analysis of single variable in dataset 1
a. Shape of the distribution
The table below gives a numerical summary of all the flights that flew in and out of
Australia in a given month.
Statistics and Data Analysis
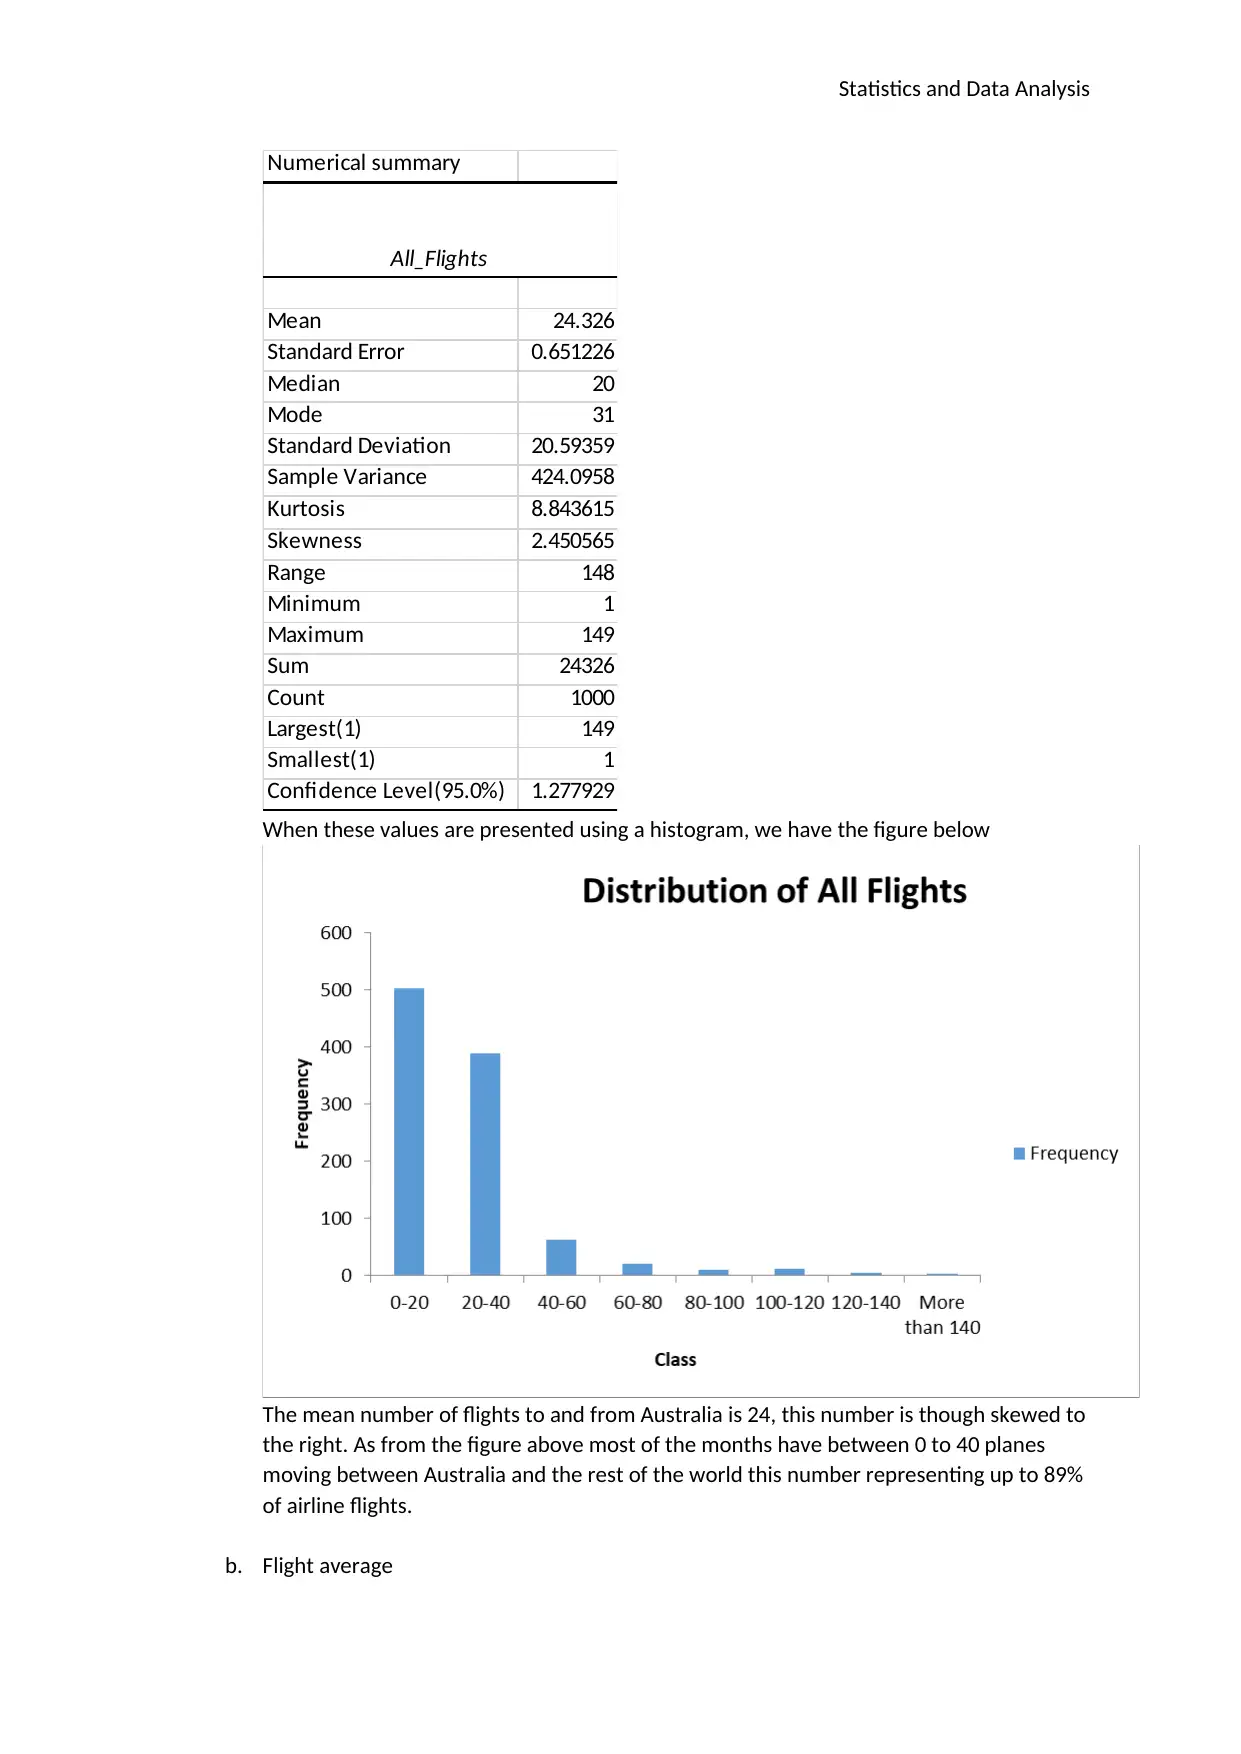
Numerical summary
All_Flights
Mean 24.326
Standard Error 0.651226
Median 20
Mode 31
Standard Deviation 20.59359
Sample Variance 424.0958
Kurtosis 8.843615
Skewness 2.450565
Range 148
Minimum 1
Maximum 149
Sum 24326
Count 1000
Largest(1) 149
Smallest(1) 1
Confidence Level(95.0%) 1.277929
When these values are presented using a histogram, we have the figure below
The mean number of flights to and from Australia is 24, this number is though skewed to
the right. As from the figure above most of the months have between 0 to 40 planes
moving between Australia and the rest of the world this number representing up to 89%
of airline flights.
b. Flight average
Statistics and Data Analysis
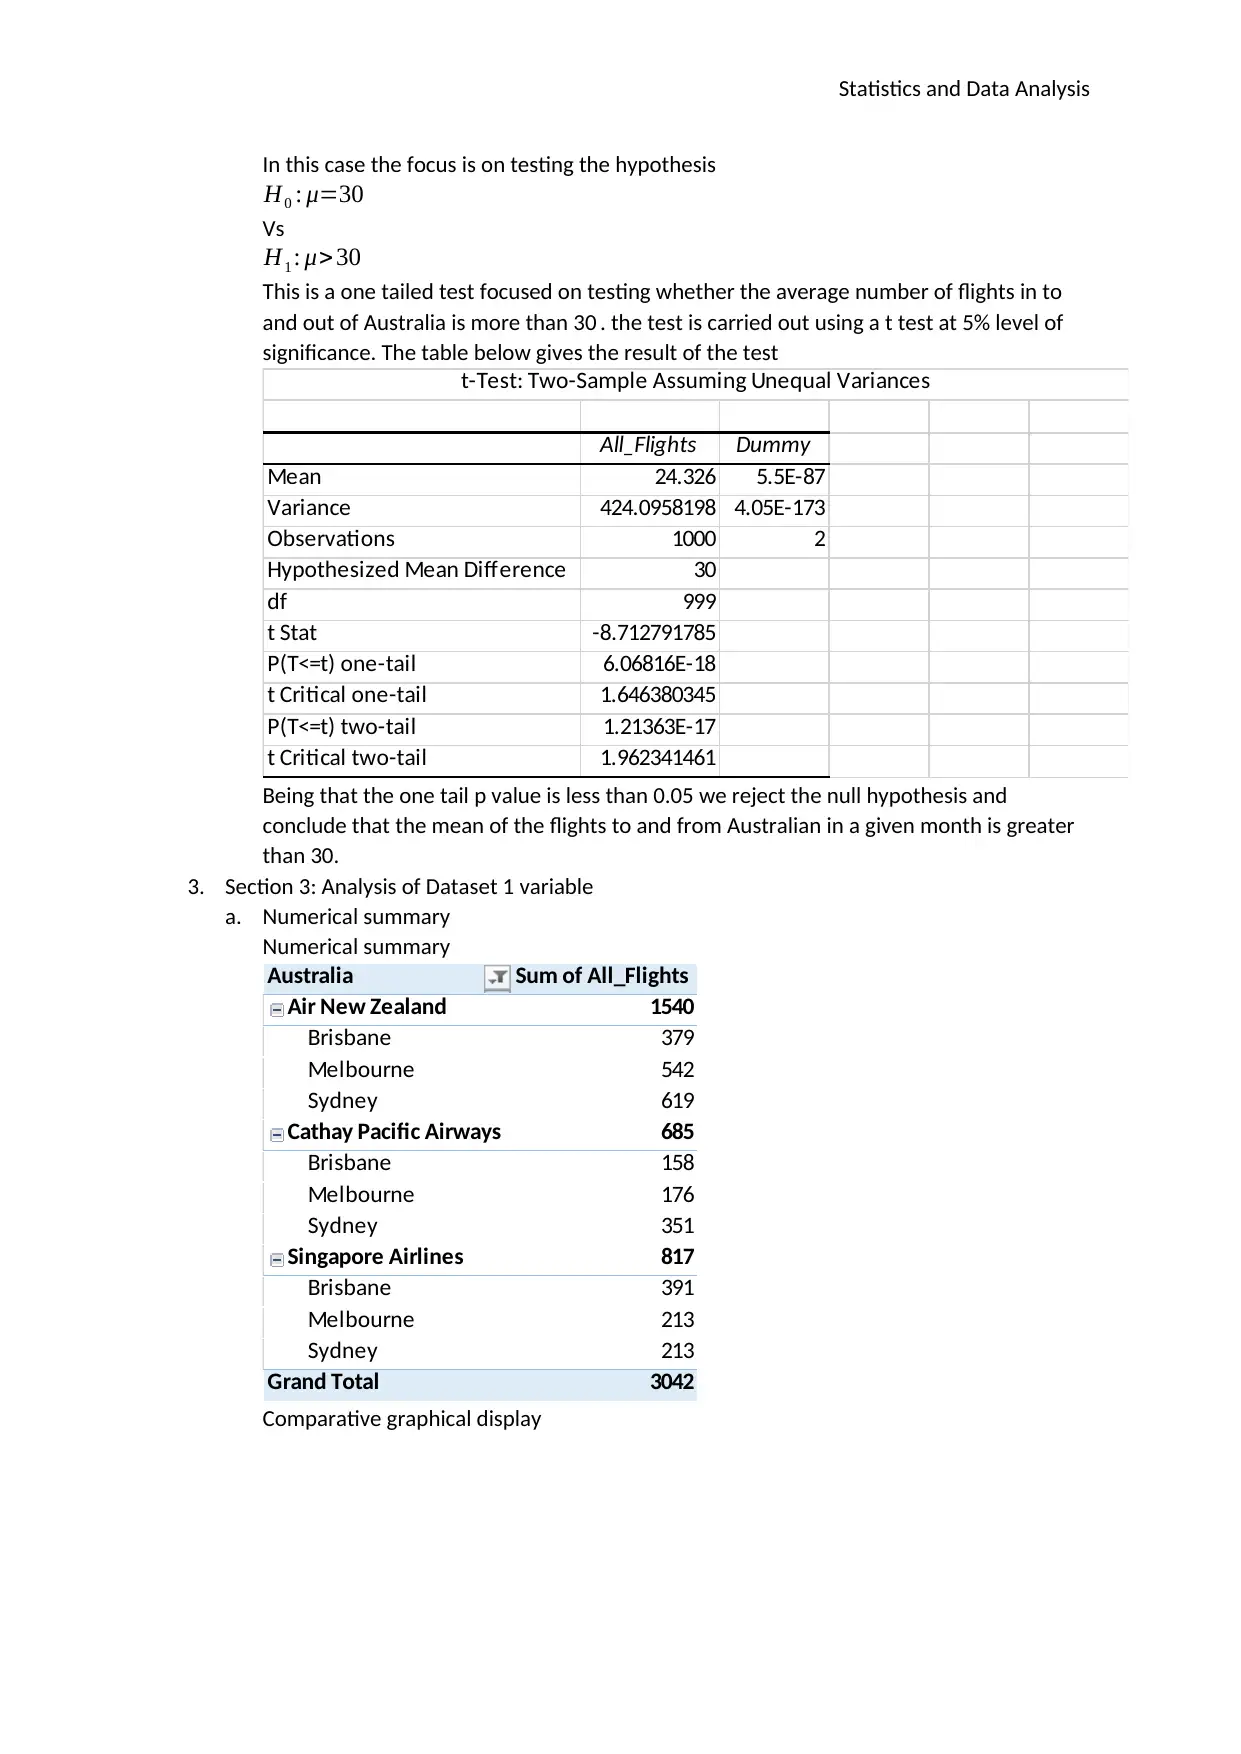
In this case the focus is on testing the hypothesis
H0 : μ=30
Vs
H1 : μ> 30
This is a one tailed test focused on testing whether the average number of flights in to
and out of Australia is more than 30 . the test is carried out using a t test at 5% level of
significance. The table below gives the result of the test
All_Flights Dummy
Mean 24.326 5.5E-87
Variance 424.0958198 4.05E-173
Observations 1000 2
Hypothesized Mean Difference 30
df 999
t Stat -8.712791785
P(T<=t) one-tail 6.06816E-18
t Critical one-tail 1.646380345
P(T<=t) two-tail 1.21363E-17
t Critical two-tail 1.962341461
t-Test: Two-Sample Assuming Unequal Variances
Being that the one tail p value is less than 0.05 we reject the null hypothesis and
conclude that the mean of the flights to and from Australian in a given month is greater
than 30.
3. Section 3: Analysis of Dataset 1 variable
a. Numerical summary
Numerical summary
Australia Sum of All_Flights
Air New Zealand 1540
Brisbane 379
Melbourne 542
Sydney 619
Cathay Pacific Airways 685
Brisbane 158
Melbourne 176
Sydney 351
Singapore Airlines 817
Brisbane 391
Melbourne 213
Sydney 213
Grand Total 3042
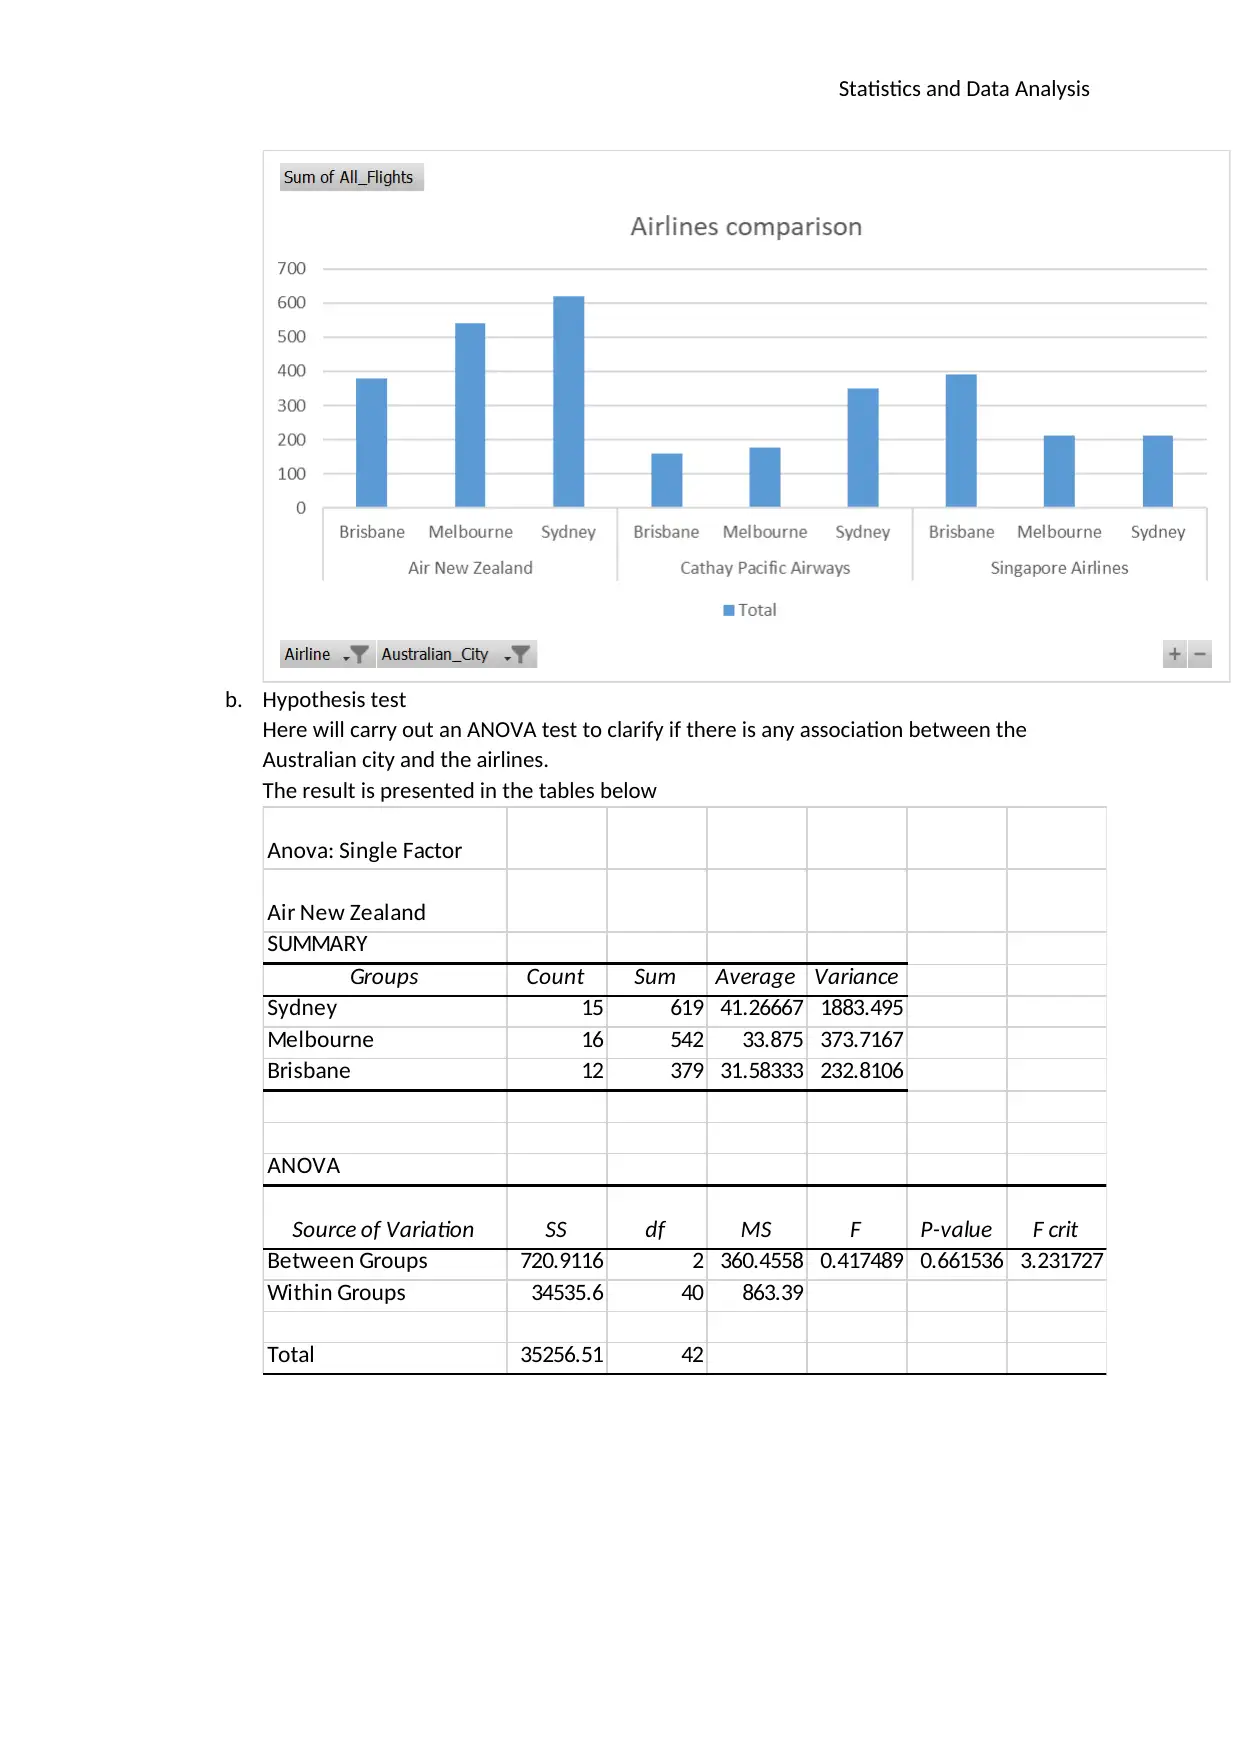
Comparative graphical display
In this case the focus is on testing the hypothesis
H0 : μ=30
Vs
H1 : μ> 30
This is a one tailed test focused on testing whether the average number of flights in to
and out of Australia is more than 30 . the test is carried out using a t test at 5% level of
significance. The table below gives the result of the test
All_Flights Dummy
Mean 24.326 5.5E-87
Variance 424.0958198 4.05E-173
Observations 1000 2
Hypothesized Mean Difference 30
df 999
t Stat -8.712791785
P(T<=t) one-tail 6.06816E-18
t Critical one-tail 1.646380345
P(T<=t) two-tail 1.21363E-17
t Critical two-tail 1.962341461
t-Test: Two-Sample Assuming Unequal Variances
Being that the one tail p value is less than 0.05 we reject the null hypothesis and
conclude that the mean of the flights to and from Australian in a given month is greater
than 30.
3. Section 3: Analysis of Dataset 1 variable
a. Numerical summary
Numerical summary
Australia Sum of All_Flights
Air New Zealand 1540
Brisbane 379
Melbourne 542
Sydney 619
Cathay Pacific Airways 685
Brisbane 158
Melbourne 176
Sydney 351
Singapore Airlines 817
Brisbane 391
Melbourne 213
Sydney 213
Grand Total 3042
Comparative graphical display
Secure Best Marks with AI Grader
Need help grading? Try our AI Grader for instant feedback on your assignments.
Statistics and Data Analysis
b. Hypothesis test
Here will carry out an ANOVA test to clarify if there is any association between the
Australian city and the airlines.
The result is presented in the tables below
Anova: Single Factor
Air New Zealand
SUMMARY
Groups Count Sum Average Variance
Sydney 15 619 41.26667 1883.495
Melbourne 16 542 33.875 373.7167
Brisbane 12 379 31.58333 232.8106
ANOVA
Source of Variation SS df MS F P-value F crit
Between Groups 720.9116 2 360.4558 0.417489 0.661536 3.231727
Within Groups 34535.6 40 863.39
Total 35256.51 42
Statistics and Data Analysis
Anova: Single Factor
Cathey Pacific
SUMMARY
Groups Count Sum Average Variance
Sydney 3 351 117 49
Melbourne 4 176 44 1448
Brisbane 11 158 14.36364 96.05455
ANOVA
Source of Variation SS df MS F P-value F crit
Between Groups 25012.4 2 12506.2 34.72308 2.35E-06 3.68232
Within Groups 5402.545 15 360.1697
Total 30414.94 17
Anova: Single Factor
Singapore
SUMMARY
Groups Count Sum Average Variance
Sydney 2 213 106.5 364.5
Melbourne 2 213 106.5 364.5
Brisbane 4 391 97.75 394.9167
ANOVA
Source of Variation SS df MS F P-value F crit
Between Groups 153.125 2 76.5625 0.200033 0.82495 5.786135
Within Groups 1913.75 5 382.75
Total 2066.875 7
c. Analysis
Overall, Air New Zealand performs better than the other two airlines in both the three
cities. Its tough more efficient in Sydney city where it records the highest number of
flights in and out of Australia. Singapore airline is the poorest performer in Sydney
despite this the airline have managed to record its highest number of flights in Brisbane
something which is unique being that the other two airlines performs poorly in this city.
From the ANOVA test above its can be concluded that for Air New Zealand there is an
association between the number of airlines in and out of the three cities. This is though
not the case with Cathey Pacific and Singapore airlines
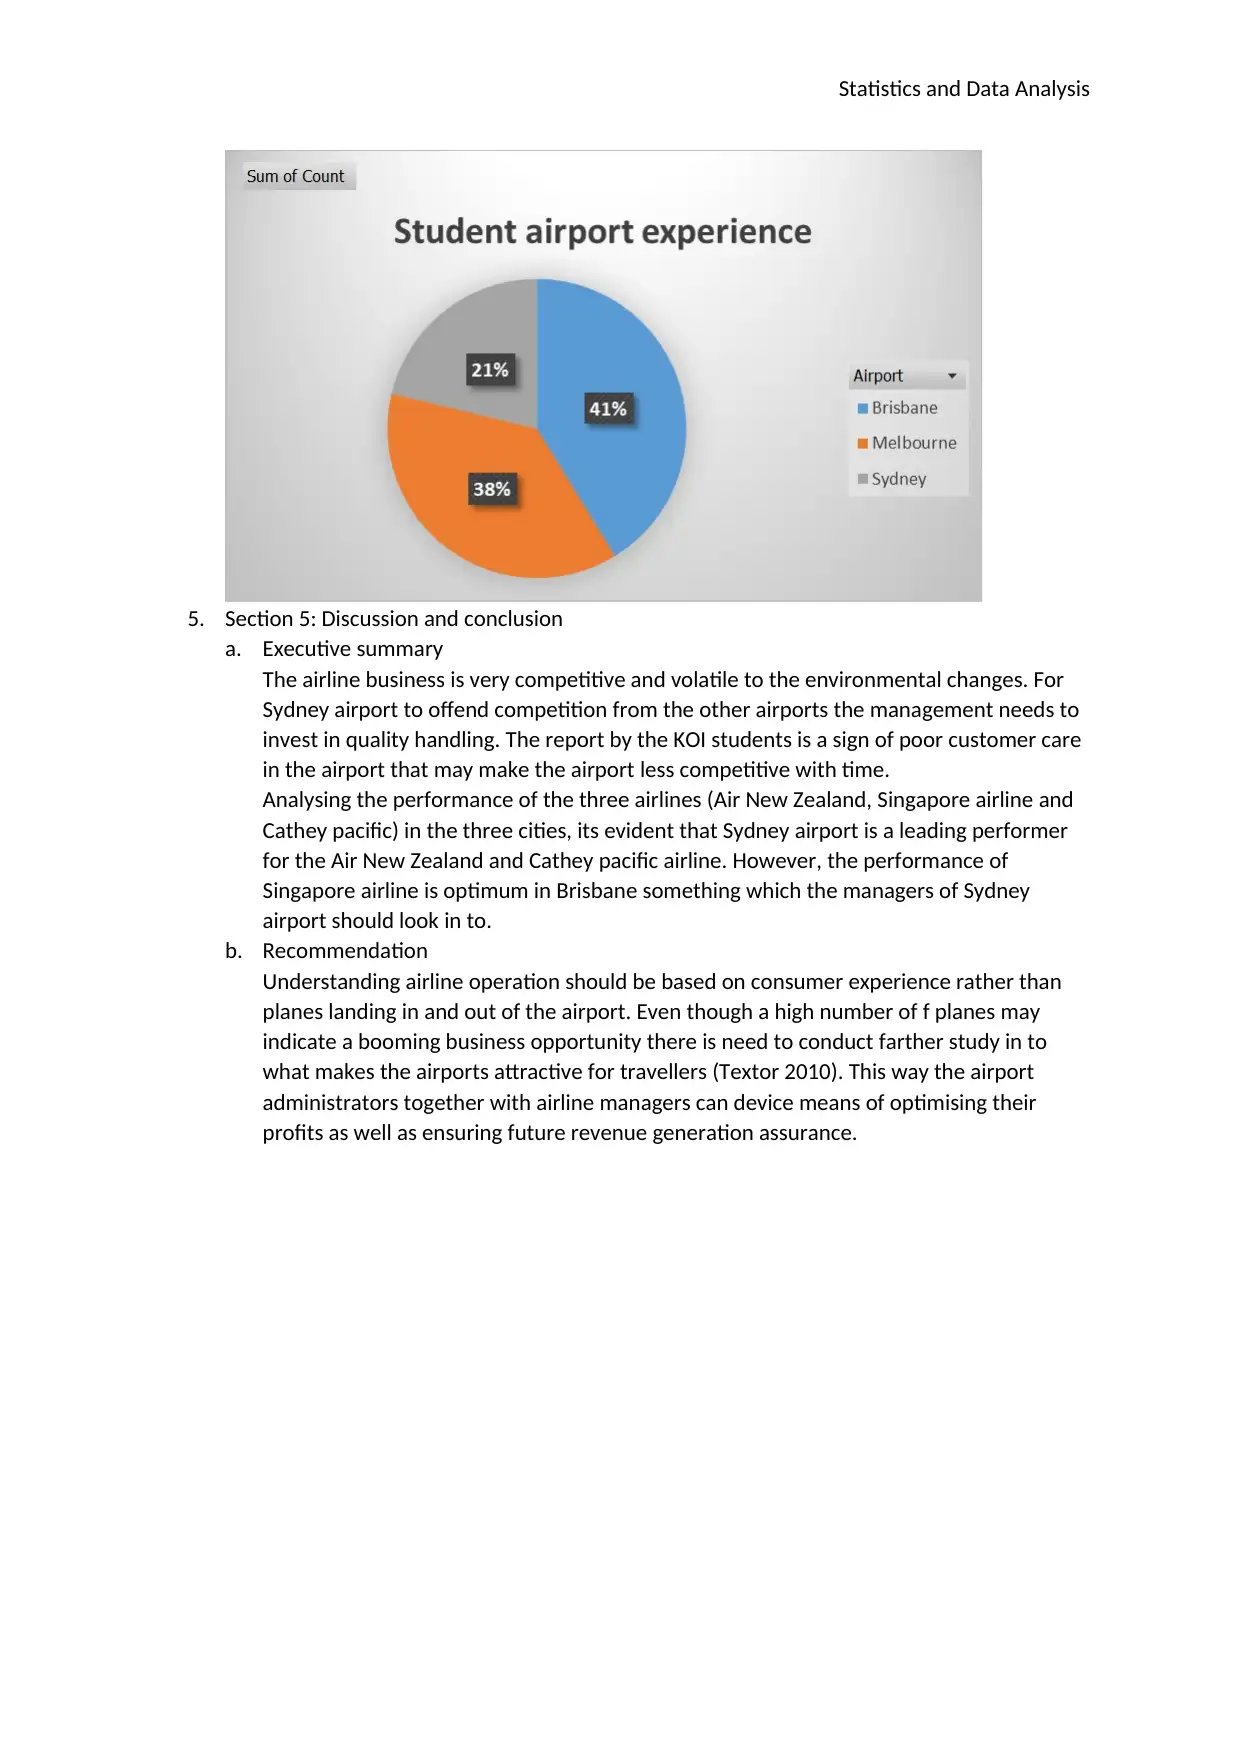
4. Section 4: Collection and analysis of dataset 2
Having sampled 80 students from KOI at random the data was recorded and analysed. From
the graphical presentation below its evident that Brisbane airport is the most popular among
the KOI students when it comes to good experience. This is followed by Melbourne with only
21% of the sampled population confessing to having good experience at the Sydney airport.
Graphical display
Anova: Single Factor
Cathey Pacific
SUMMARY
Groups Count Sum Average Variance
Sydney 3 351 117 49
Melbourne 4 176 44 1448
Brisbane 11 158 14.36364 96.05455
ANOVA
Source of Variation SS df MS F P-value F crit
Between Groups 25012.4 2 12506.2 34.72308 2.35E-06 3.68232
Within Groups 5402.545 15 360.1697
Total 30414.94 17
Anova: Single Factor
Singapore
SUMMARY
Groups Count Sum Average Variance
Sydney 2 213 106.5 364.5
Melbourne 2 213 106.5 364.5
Brisbane 4 391 97.75 394.9167
ANOVA
Source of Variation SS df MS F P-value F crit
Between Groups 153.125 2 76.5625 0.200033 0.82495 5.786135
Within Groups 1913.75 5 382.75
Total 2066.875 7
c. Analysis
Overall, Air New Zealand performs better than the other two airlines in both the three
cities. Its tough more efficient in Sydney city where it records the highest number of
flights in and out of Australia. Singapore airline is the poorest performer in Sydney
despite this the airline have managed to record its highest number of flights in Brisbane
something which is unique being that the other two airlines performs poorly in this city.
From the ANOVA test above its can be concluded that for Air New Zealand there is an
association between the number of airlines in and out of the three cities. This is though
not the case with Cathey Pacific and Singapore airlines
4. Section 4: Collection and analysis of dataset 2
Having sampled 80 students from KOI at random the data was recorded and analysed. From
the graphical presentation below its evident that Brisbane airport is the most popular among
the KOI students when it comes to good experience. This is followed by Melbourne with only
21% of the sampled population confessing to having good experience at the Sydney airport.
Graphical display
Statistics and Data Analysis
5. Section 5: Discussion and conclusion
a. Executive summary
The airline business is very competitive and volatile to the environmental changes. For
Sydney airport to offend competition from the other airports the management needs to
invest in quality handling. The report by the KOI students is a sign of poor customer care
in the airport that may make the airport less competitive with time.
Analysing the performance of the three airlines (Air New Zealand, Singapore airline and
Cathey pacific) in the three cities, its evident that Sydney airport is a leading performer
for the Air New Zealand and Cathey pacific airline. However, the performance of
Singapore airline is optimum in Brisbane something which the managers of Sydney
airport should look in to.
b. Recommendation
Understanding airline operation should be based on consumer experience rather than
planes landing in and out of the airport. Even though a high number of f planes may
indicate a booming business opportunity there is need to conduct farther study in to
what makes the airports attractive for travellers (Textor 2010). This way the airport
administrators together with airline managers can device means of optimising their
profits as well as ensuring future revenue generation assurance.
Paraphrase This Document
Need a fresh take? Get an instant paraphrase of this document with our AI Paraphraser

Statistics and Data Analysis
References
Singh, H 2018, Role of Big Data Analytics in Enterprise Decision Making. [Online]
Available at: http://customerthink.com/role-of-big-data-analytics-in-enterprise-decision-making/
[Accessed 26 January 2019].
Textor, A 2010, Flights: Six essential features of good airports. [Online]
Available at: https://www.eurocheapo.com/blog/flights-six-essential-features-of-good-airports.html
[Accessed 26 January 2009].
1 out of 8
Related Documents


Your All-in-One AI-Powered Toolkit for Academic Success.
+13062052269
info@desklib.com
Available 24*7 on WhatsApp / Email
![[object Object]](/_next/static/media/star-bottom.7253800d.svg)
Unlock your academic potential
© 2024 | Zucol Services PVT LTD | All rights reserved.