Statistics for Management : Assignment Sample
16 Pages4020 Words369 Views
Added on 2020-10-05
Statistics for Management : Assignment Sample
Added on 2020-10-05
ShareRelated Documents
STATISTICS FORMANAGEMENT
TABLE OF CONTENTSINTRODUCTION...........................................................................................................................1ACTIVITY 1....................................................................................................................................1a. On basis of ONS, locate Consumer price Indices (CPI and CPIH) and retail price index......1b. Reflecting graph of above indices from year 2007 to 2017.....................................................3c. Explaining difference among Consumer and Retail Price Index.............................................3d. Application of Consumer price Index with calculation of annual inflation ............................4e. Stating significance on basis of inflation rate..........................................................................6ACTIVITY 2....................................................................................................................................6Hourly wage rate..........................................................................................................................6a.1 Application of ogive for estimating median on basis of quartile and hourly earnings..........6a.2 Stating mean and standard deviation of hourly earnings.......................................................9b. Comparing earnings of Manchester and London basis of statistical analysis.......................10ACTIVITY 3..................................................................................................................................10a. Carrying paired t test with 5% level of significance for investigating mean length of timeundertaken for process of set of forms.......................................................................................10b. Stating full usual condition of t test.......................................................................................11c. Constructing 99% confidence interval mean reduction.........................................................11ACTIVITY 4..................................................................................................................................12a. Using data with ONS, producing chart for indicating alteration in CPI, RPI and CPIH.......12b. Producing ogive for cumulative % of staff versus hourly earnings.......................................13CONCLUSION..............................................................................................................................13REFERENCES..............................................................................................................................14
INTRODUCTIONStatistics is replicated as data science which will provide help for enabling presentation,gathering and analysis of gathering data. The management applies numerous statistical tools forarticulating outcome and with objective of quality assurance, financial analysis and operations aswell with other areas of business. The present report will give brief discussion about inflationmeasure index such as RPI, CPI and CPIH which is extracted from Office of National statisticswebsite. In the similar aspect, it will be showing variance in RPI and CPI along with importanceof inflation rate. Further, this will be using ogive and other charts for showing percentage changeand outcome along with median and standard deviations for hourly earnings. It will articulateabout comparison about earnings of two regions as London and Manchester with their hourlyearnings.ACTIVITY 1a. On basis of ONS, locate Consumer price Indices (CPI and CPIH) and retail price indexRetail Price Index: In the current scenario, it is used with different price and income onbasis of tax allowances, pensions, state benefits along with index-linked gilts. It is measure ofinflation of consumer on basis of UK's ONS. In simple words, it tracks alterations in cost of afixed basket of goods and reflects changes in price of multiple range of goods chosen as essentialproducts in budget of a normal household.Consumer Price Indices: It forms particular basis of inflation target of governmentwhich has been required for attaining Bank of England's Monetary policy committee. In simplewords, it is monthly measurement of US prices for various household goods along with servicesas it reports deflation and inflation as well. Generally, it is used by federal government withapplication of identifying economic policies with requirement of modifying for purpose ofpreventing inflation. In the similar aspect, government agencies uses CPI for adjusting prices inother government economic indicators like gross domestic products and for improving benefitlevel for recipients of Social security along with other programs by government (Dabbicco,2018).CPIH: It is referred as additional measure for consumer price inflation which consist ofvarious other measures of owner occupier's housing costs and regulator thinks about deserving tonational statistic. In simple words, it is not measure which considers change in house prices as itis essential and conventional familiar measure of consumer price inflation of UK which is1
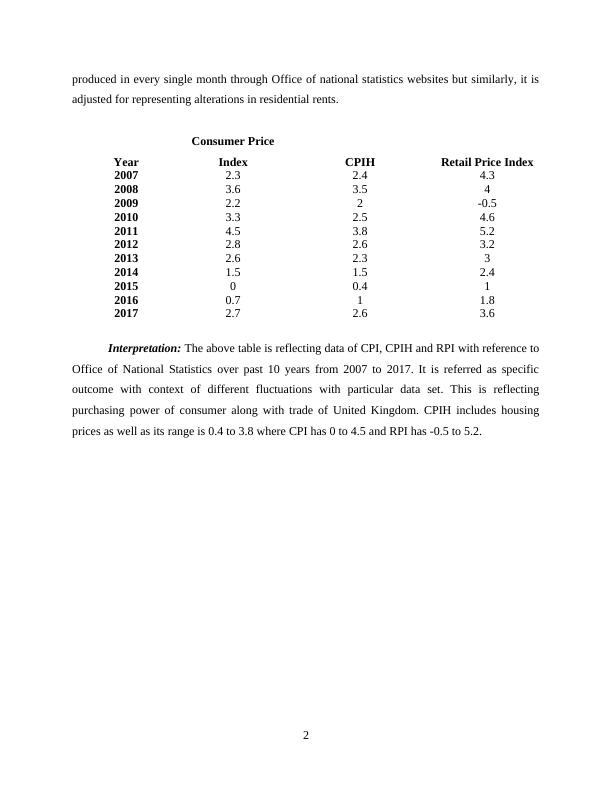
produced in every single month through Office of national statistics websites but similarly, it isadjusted for representing alterations in residential rents.YearConsumer PriceIndexCPIHRetail Price Index20072.32.44.320083.63.5420092.22-0.520103.32.54.620114.53.85.220122.82.63.220132.62.3320141.51.52.4201500.4120160.711.820172.72.63.6Interpretation: The above table is reflecting data of CPI, CPIH and RPI with reference toOffice of National Statistics over past 10 years from 2007 to 2017. It is referred as specificoutcome with context of different fluctuations with particular data set. This is reflectingpurchasing power of consumer along with trade of United Kingdom. CPIH includes housingprices as well as its range is 0.4 to 3.8 where CPI has 0 to 4.5 and RPI has -0.5 to 5.2.2
End of preview
Want to access all the pages? Upload your documents or become a member.
Related Documents
(PDF) Statistics for management | Assignment Samplelg...
|15
|2703
|98
Statistics for Management : PDFlg...
|20
|4443
|300
Statistics for Management Assignment Solutionlg...
|16
|3449
|157
Statistics For Management (pdf)lg...
|15
|3242
|330
Statistics Management Assignment - Solutionlg...
|15
|3194
|285
Inflationary Analysis Using Consumer Price Index and Retail Price Indexlg...
|17
|3322
|335