Results and Discussion of Demographic Profile, Reliability Test, Factor Analysis, and Multiple Regression Analysis
Added on 2023-06-14
47 Pages7502 Words248 Views
Results and Discussion
Demographic Profile of the respondents
Results shows that majority of the respondents are female and the proportion of male
comparatively less. Usually in the tax payer database male dominate female taxpayers. Similarly
the results from age distribution shows that 44 % of the respondents are in the age group of 30 -
40, followed by 32 % in 20 -30 age group. In terms of education level 51 5 have bachelor degree
followed by 47 % with master degree. Very less respondents have Phd degree and also the
respondents with only high school degree is also less. Around 58 % of the respondents are
studying accounts which means that people are trying to get the knowledge about the tax
compliance.
In terms of position in the most of the respondents are in the middle management followed by
high management and executive level. This shows that the respondents in the study are most
likely to be in the tax paying bracket. When asked about the TRN number 86 % of the
respondents said that they have TRN number which indicates most of the them pay their
tax, .Results from the tax registration type shows that most of them comes under company VAT
registration followed by legal person VAT registration. Results from turn over shows that
majority of the firms have turnover between 375000 and 1.5 million followed by 27 % having
turnover between 187000 and 375000. The detailed table and graph of the demographic profile
has been shown in the appendix 1.
2) Reliability test
For the current research the reliability test has been conducted to examine the internal
consistency of the questions included in the study. The reliability has been examined using the
Cronbach’s alpha. Since the questionnaire included the liker scale questions, it is considered to
be the most appropriate measure of reliability. In the current research the liker scale was set as
following:
1-Strongly Disagree/ Strongly Unlikely
5- Strongly Agree/Very Likely
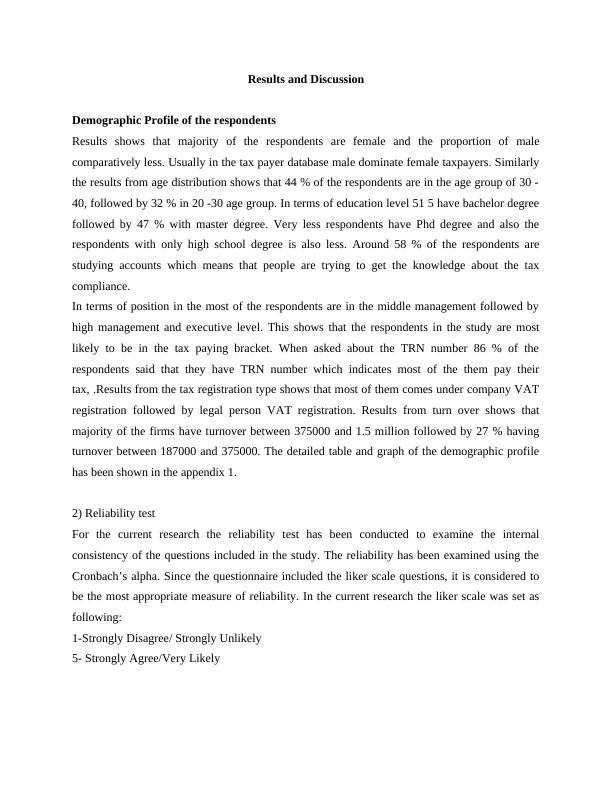
Generally the value of Cronbach’s alpha above 0.6 is considered to be acceptable. The results for
Cronbach alpha in the current case is shown in the table below and its shows that the value is
0.907. This indicates that the questions included in the study to collect the data as per the
requirements of the study.
Reliability Statistics
Cronbach's Alpha N of Items
.907 36
Table 1 Results from the Cronbach’s Alpha
While conducting the reliability test, it was also analyzed whether removing some variable can
further lead to increase in the Cronbach’s Alpha value.
Reliability Statistics
Cronbach's Alpha N of Items
.910 35
Table 2 Results from the improvised Cronbach Alpha
On the basis of the results it was realized that, if the variable (question no 31) is removed from
the variable list the value of the Cronbach’s Alpha increases slightly to 0.910. Even though the
value do not increase much, it is still better than the value when all the variables are included.
Reliability test for each independent variable
Tax complying attitude
Reliability Statistics
Cronbach's
Alpha
Cronbach's
Alpha Based
on
Standardized
Items
N of Items
.872 .876 6
Summary Item Statistics
Mean Minimu
m
Maximu
m
Range Maximum /
Minimum
Variance N of
Items
Item Means 4.200 4.013 4.450 .437 1.109 .040 6
Item
Variances
.807 .449 1.053 .604 2.345 .045 6
For tax compliance variable the Cron bach alpha is 0.876 which shows that the internal
consistency of the factors has been established.
Normative expectation
Reliability Statistics
Cronbach's
Alpha
Cronbach's
Alpha Based
on
Standardized
Items
N of Items
.727 .731 6
Summary Item Statistics
Mean Minimu
m
Maximu
m
Range Maximum /
Minimum
Variance N of
Items
Item Means 4.010 3.854 4.132 .278 1.072 .011 6
Item
Variances
1.245 .860 1.859 .998 2.160 .124 6
Perceived Tax compliance Control
For perceived tax compliance control the Cronbach alpha value is 0.727 which is higher than the
minimum required of 0.6 however the value is lower as compared to the reliability of the other
independent variables.
Mean Minimu
m
Maximu
m
Range Maximum /
Minimum
Variance N of
Items
Item Means 4.200 4.013 4.450 .437 1.109 .040 6
Item
Variances
.807 .449 1.053 .604 2.345 .045 6
For tax compliance variable the Cron bach alpha is 0.876 which shows that the internal
consistency of the factors has been established.
Normative expectation
Reliability Statistics
Cronbach's
Alpha
Cronbach's
Alpha Based
on
Standardized
Items
N of Items
.727 .731 6
Summary Item Statistics
Mean Minimu
m
Maximu
m
Range Maximum /
Minimum
Variance N of
Items
Item Means 4.010 3.854 4.132 .278 1.072 .011 6
Item
Variances
1.245 .860 1.859 .998 2.160 .124 6
Perceived Tax compliance Control
For perceived tax compliance control the Cronbach alpha value is 0.727 which is higher than the
minimum required of 0.6 however the value is lower as compared to the reliability of the other
independent variables.
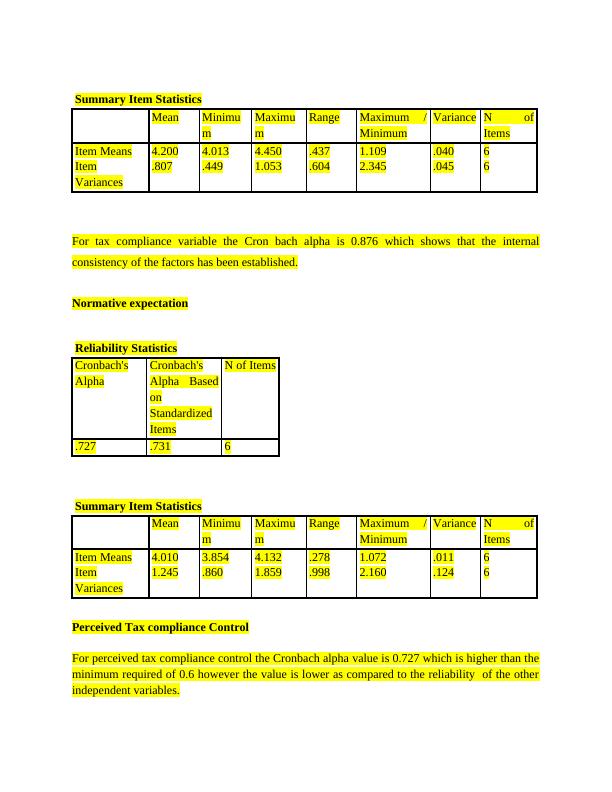
Reliability Statistics
Cronbach's
Alpha
Cronbach's
Alpha Based
on
Standardized
Items
N of Items
.896 .893 14
Summary Item Statistics
Mean Minimu
m
Maximu
m
Range Maximum /
Minimum
Variance N of
Items
Item Means 3.876 3.649 4.199 .550 1.151 .029 14
Item
Variances
1.126 .778 1.525 .747 1.960 .063 14
For the last independent variable also the Cronbach alpha is 0.896 which suggests that the
internal consistency of the independent variable have also been established.
Factor analysis
In this section the results from the factor analysis has been discussed. Factor analysis shows
whether the questionnaire used to collect the data has been as per the requirement of the research
or not.
Firstly the results from the KMO and the Bartlett Test has been shown in the table below.
KMO and Bartlett's Test
Kaiser-Meyer-Olkin Measure of Sampling
Adequacy.
.347
Bartlett's Test of
Sphericity
Approx. Chi-Square 8552.717
df 630
Sig. .000
Table 3 Results from the KMO and Bartlett’s Test
Cronbach's
Alpha
Cronbach's
Alpha Based
on
Standardized
Items
N of Items
.896 .893 14
Summary Item Statistics
Mean Minimu
m
Maximu
m
Range Maximum /
Minimum
Variance N of
Items
Item Means 3.876 3.649 4.199 .550 1.151 .029 14
Item
Variances
1.126 .778 1.525 .747 1.960 .063 14
For the last independent variable also the Cronbach alpha is 0.896 which suggests that the
internal consistency of the independent variable have also been established.
Factor analysis
In this section the results from the factor analysis has been discussed. Factor analysis shows
whether the questionnaire used to collect the data has been as per the requirement of the research
or not.
Firstly the results from the KMO and the Bartlett Test has been shown in the table below.
KMO and Bartlett's Test
Kaiser-Meyer-Olkin Measure of Sampling
Adequacy.
.347
Bartlett's Test of
Sphericity
Approx. Chi-Square 8552.717
df 630
Sig. .000
Table 3 Results from the KMO and Bartlett’s Test
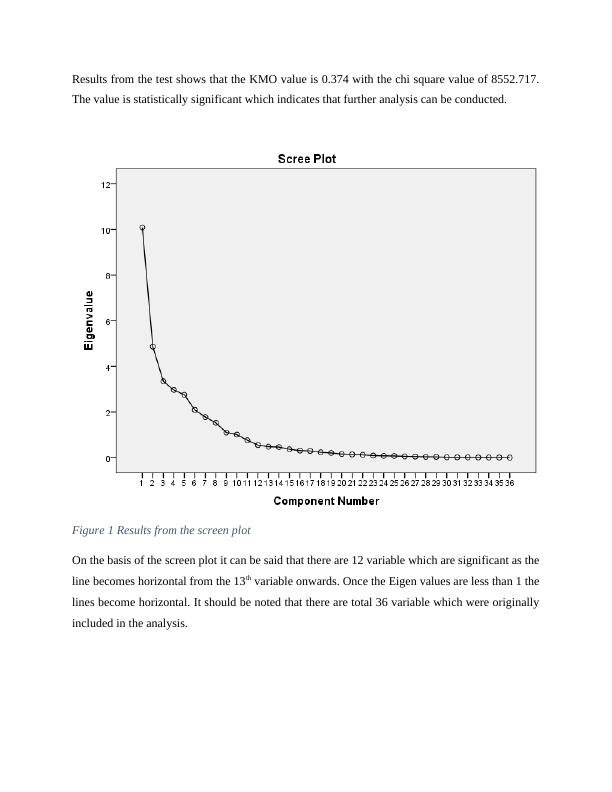
Results from the test shows that the KMO value is 0.374 with the chi square value of 8552.717.
The value is statistically significant which indicates that further analysis can be conducted.
Figure 1 Results from the screen plot
On the basis of the screen plot it can be said that there are 12 variable which are significant as the
line becomes horizontal from the 13th variable onwards. Once the Eigen values are less than 1 the
lines become horizontal. It should be noted that there are total 36 variable which were originally
included in the analysis.
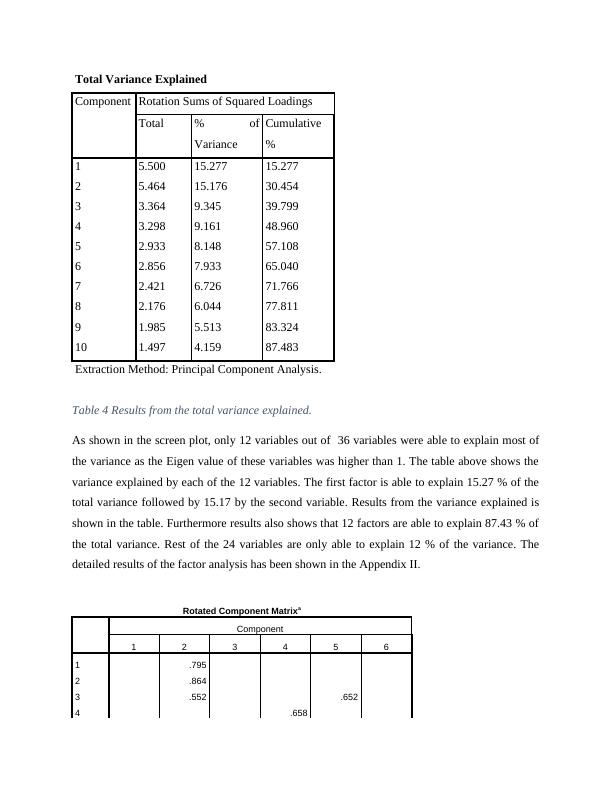
Total Variance Explained
Component Rotation Sums of Squared Loadings
Total % of
Variance
Cumulative
%
1 5.500 15.277 15.277
2 5.464 15.176 30.454
3 3.364 9.345 39.799
4 3.298 9.161 48.960
5 2.933 8.148 57.108
6 2.856 7.933 65.040
7 2.421 6.726 71.766
8 2.176 6.044 77.811
9 1.985 5.513 83.324
10 1.497 4.159 87.483
Extraction Method: Principal Component Analysis.
Table 4 Results from the total variance explained.
As shown in the screen plot, only 12 variables out of 36 variables were able to explain most of
the variance as the Eigen value of these variables was higher than 1. The table above shows the
variance explained by each of the 12 variables. The first factor is able to explain 15.27 % of the
total variance followed by 15.17 by the second variable. Results from the variance explained is
shown in the table. Furthermore results also shows that 12 factors are able to explain 87.43 % of
the total variance. Rest of the 24 variables are only able to explain 12 % of the variance. The
detailed results of the factor analysis has been shown in the Appendix II.
Rotated Component Matrixa
Component
1 2 3 4 5 6
1 .795
2 .864
3 .552 .652
4 .658
Component Rotation Sums of Squared Loadings
Total % of
Variance
Cumulative
%
1 5.500 15.277 15.277
2 5.464 15.176 30.454
3 3.364 9.345 39.799
4 3.298 9.161 48.960
5 2.933 8.148 57.108
6 2.856 7.933 65.040
7 2.421 6.726 71.766
8 2.176 6.044 77.811
9 1.985 5.513 83.324
10 1.497 4.159 87.483
Extraction Method: Principal Component Analysis.
Table 4 Results from the total variance explained.
As shown in the screen plot, only 12 variables out of 36 variables were able to explain most of
the variance as the Eigen value of these variables was higher than 1. The table above shows the
variance explained by each of the 12 variables. The first factor is able to explain 15.27 % of the
total variance followed by 15.17 by the second variable. Results from the variance explained is
shown in the table. Furthermore results also shows that 12 factors are able to explain 87.43 % of
the total variance. Rest of the 24 variables are only able to explain 12 % of the variance. The
detailed results of the factor analysis has been shown in the Appendix II.
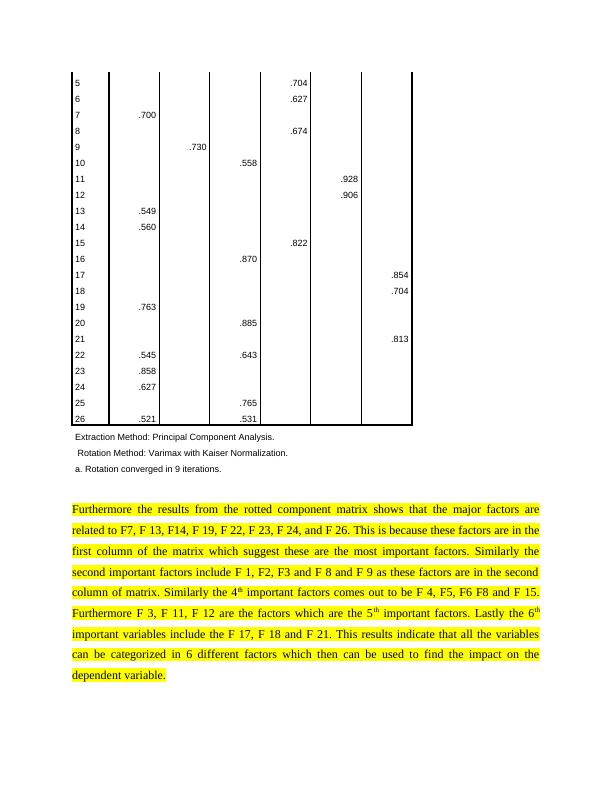
Rotated Component Matrixa
Component
1 2 3 4 5 6
1 .795
2 .864
3 .552 .652
4 .658
5 .704
6 .627
7 .700
8 .674
9 .730
10 .558
11 .928
12 .906
13 .549
14 .560
15 .822
16 .870
17 .854
18 .704
19 .763
20 .885
21 .813
22 .545 .643
23 .858
24 .627
25 .765
26 .521 .531
Extraction Method: Principal Component Analysis.
Rotation Method: Varimax with Kaiser Normalization.
a. Rotation converged in 9 iterations.
Furthermore the results from the rotted component matrix shows that the major factors are
related to F7, F 13, F14, F 19, F 22, F 23, F 24, and F 26. This is because these factors are in the
first column of the matrix which suggest these are the most important factors. Similarly the
second important factors include F 1, F2, F3 and F 8 and F 9 as these factors are in the second
column of matrix. Similarly the 4th important factors comes out to be F 4, F5, F6 F8 and F 15.
Furthermore F 3, F 11, F 12 are the factors which are the 5th important factors. Lastly the 6th
important variables include the F 17, F 18 and F 21. This results indicate that all the variables
can be categorized in 6 different factors which then can be used to find the impact on the
dependent variable.
Multiple regression analysis
The regression analysis is has been performed to find the impact of the independent variables on
the dependent variable. The impact is decided on the basis of the regression coefficient of the
independent. If the coefficient is positive then the independent variable have positive and if the
regression coefficient is negative then the impact is also negative. For the current research the
dependent and the independent variables are as follows:
Dependent variable:
Tax compliance intention
Independent variable:
Tax complying attitude
Normative expectation
Perceived Tax compliance Control
Moderator variable:
Perceived Tax compliance Control * tax compliance intention
End of preview
Want to access all the pages? Upload your documents or become a member.
Related Documents
Data Analysis in Research Paperlg...
|46
|7154
|101
Results and Interpretations PDFlg...
|22
|5215
|17
Results and Analysis of Quality Management in Semiconductor Manufacturing Industrylg...
|28
|8626
|383
Findings and Analysis - Usage of e-Walletslg...
|31
|5318
|21
Data Analysis of Performance Appraisal System and Employee Performance at Ministrylg...
|36
|3270
|428
Data Handling & Using ICTlg...
|9
|2159
|25