Comprehensive Analysis: Consumer Decision-Making Style Inventory

Verified

Added on  2019/09/26

|34
|6315
|487
Homework Assignment
AI Summary
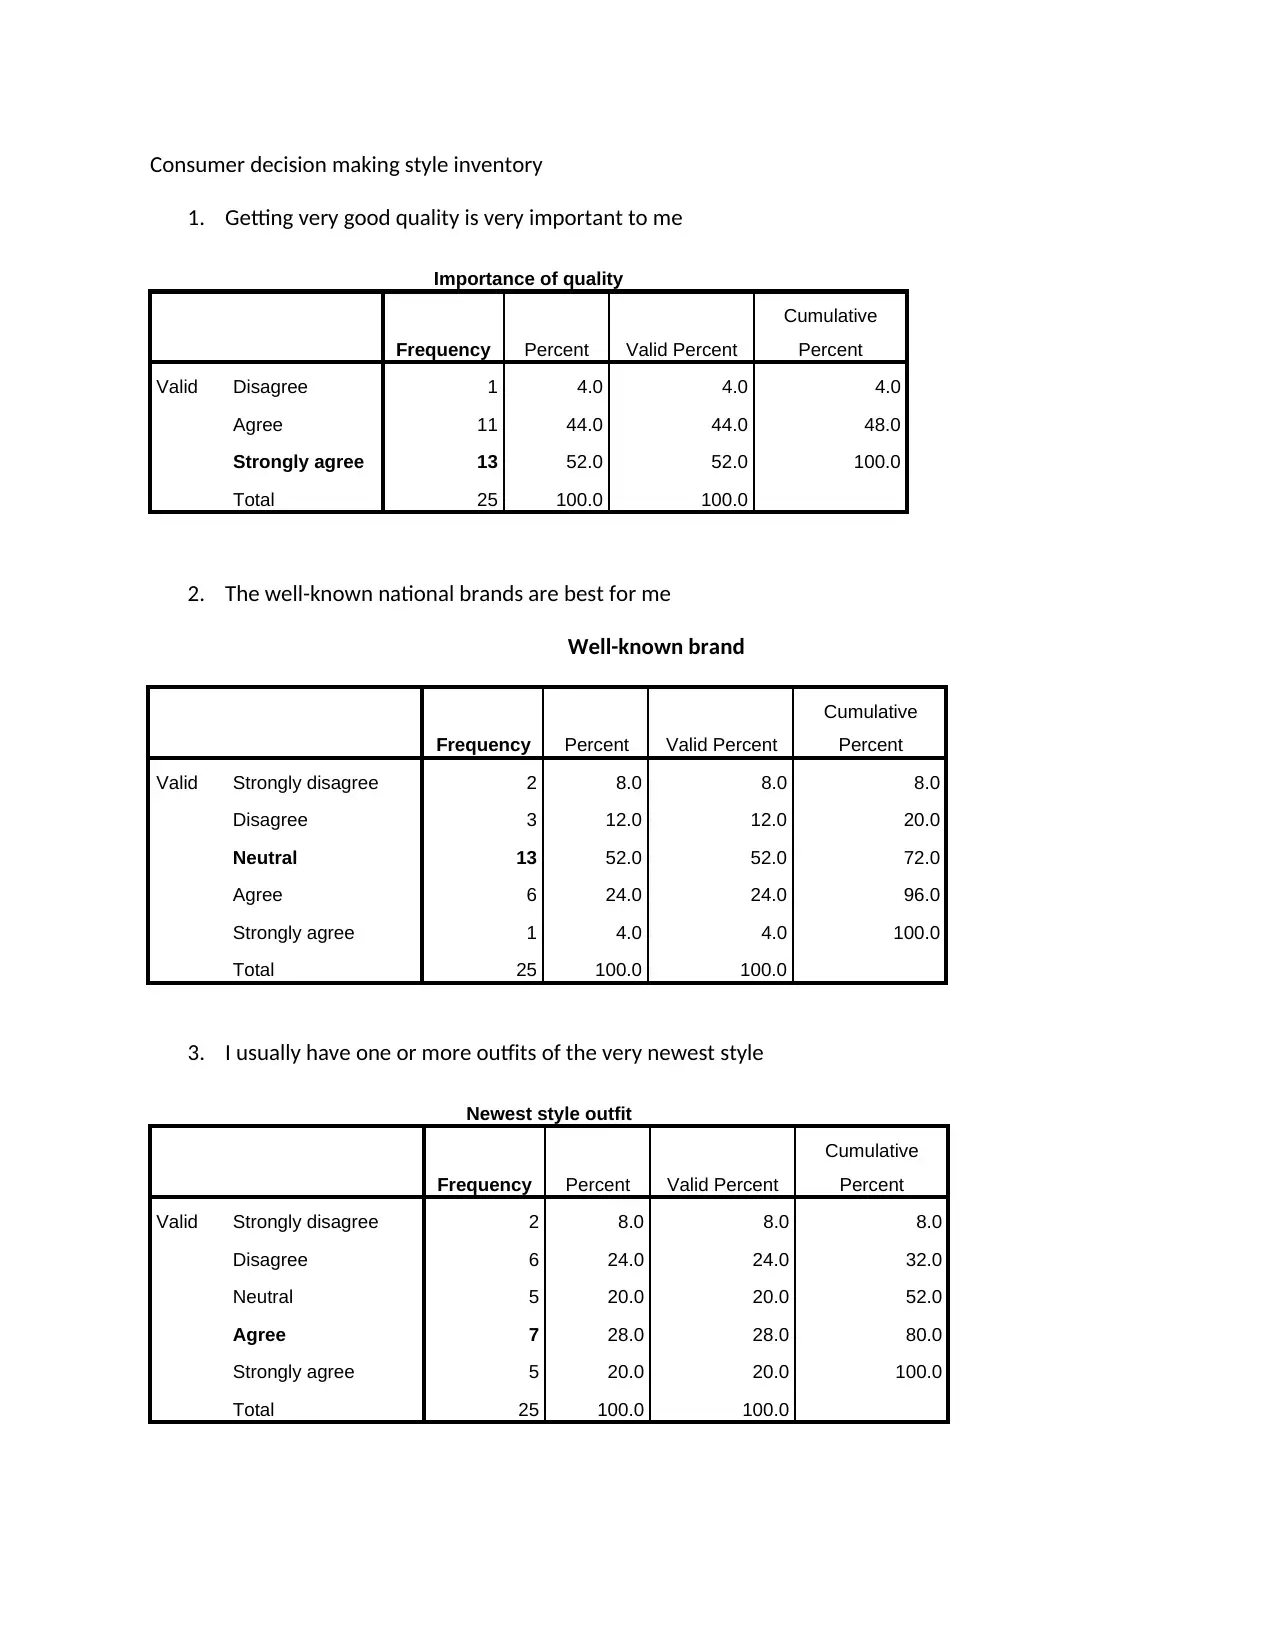
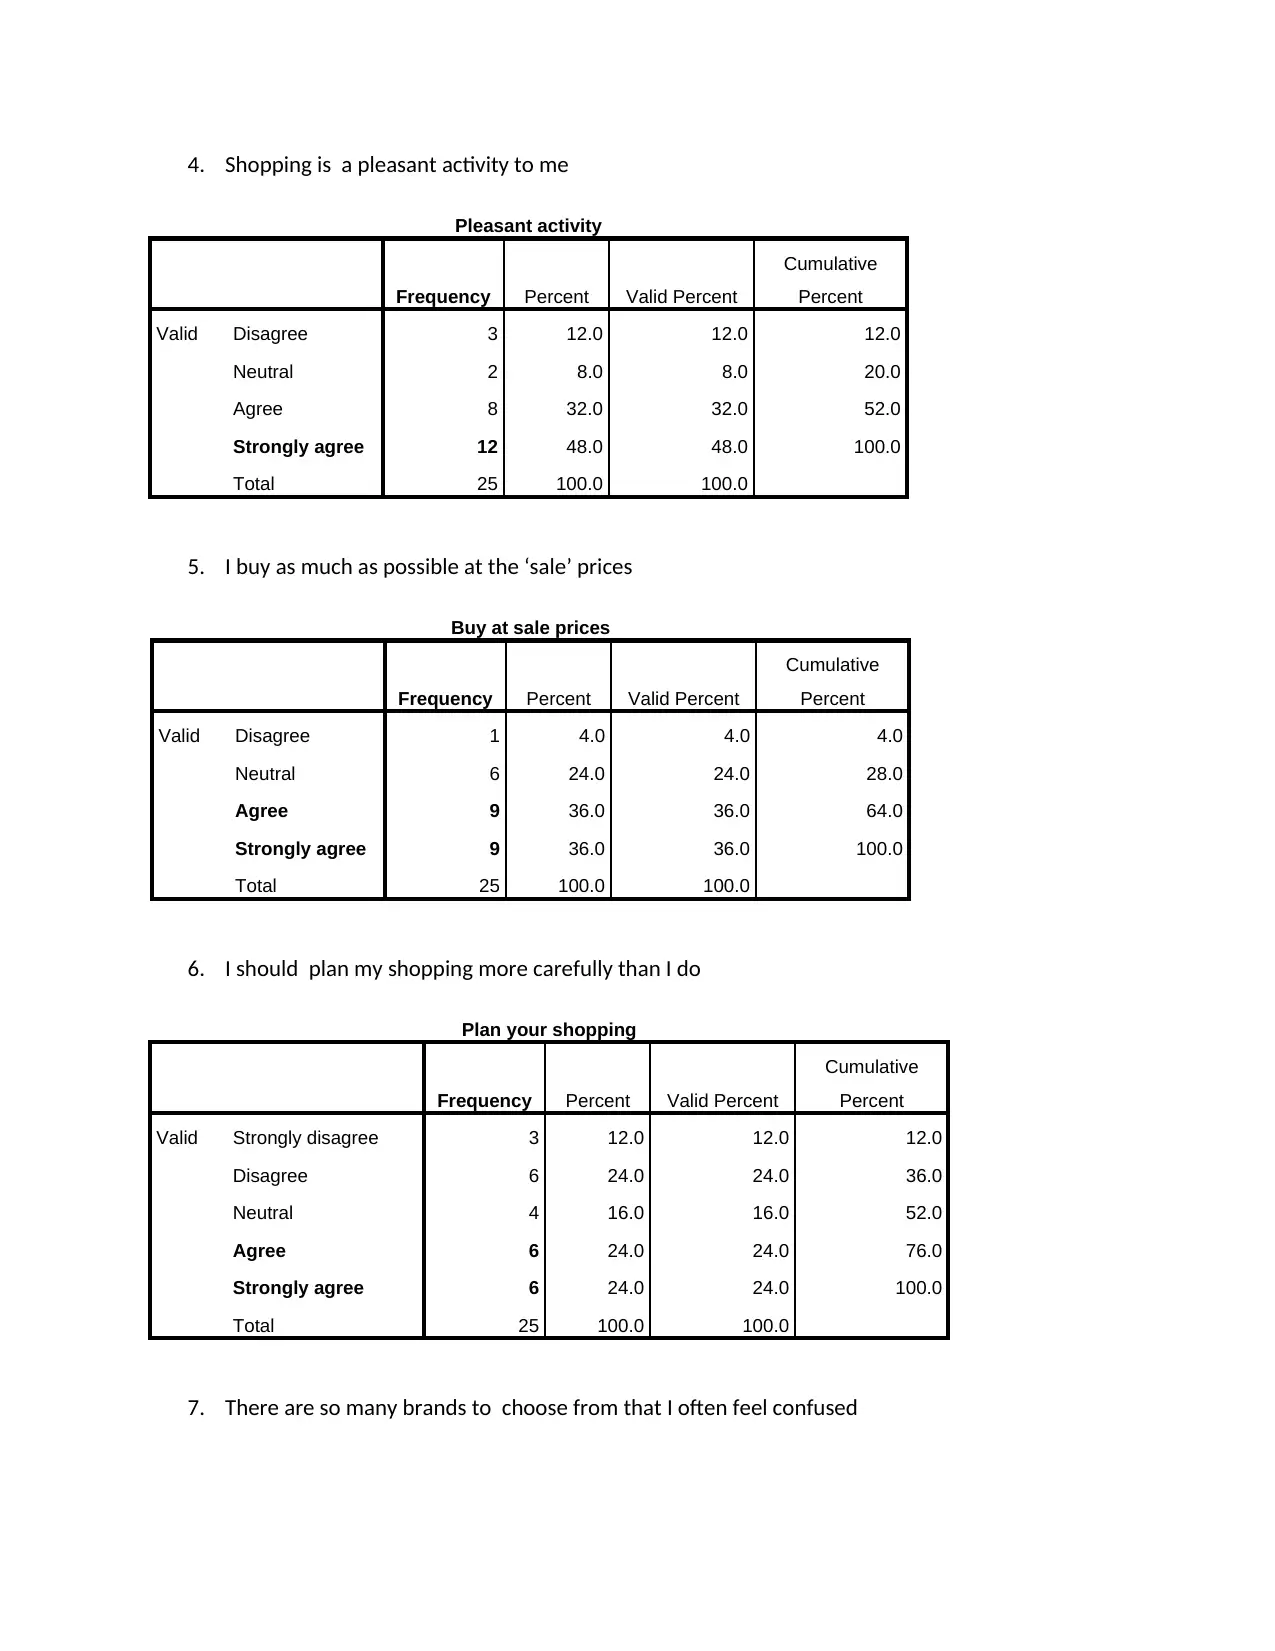
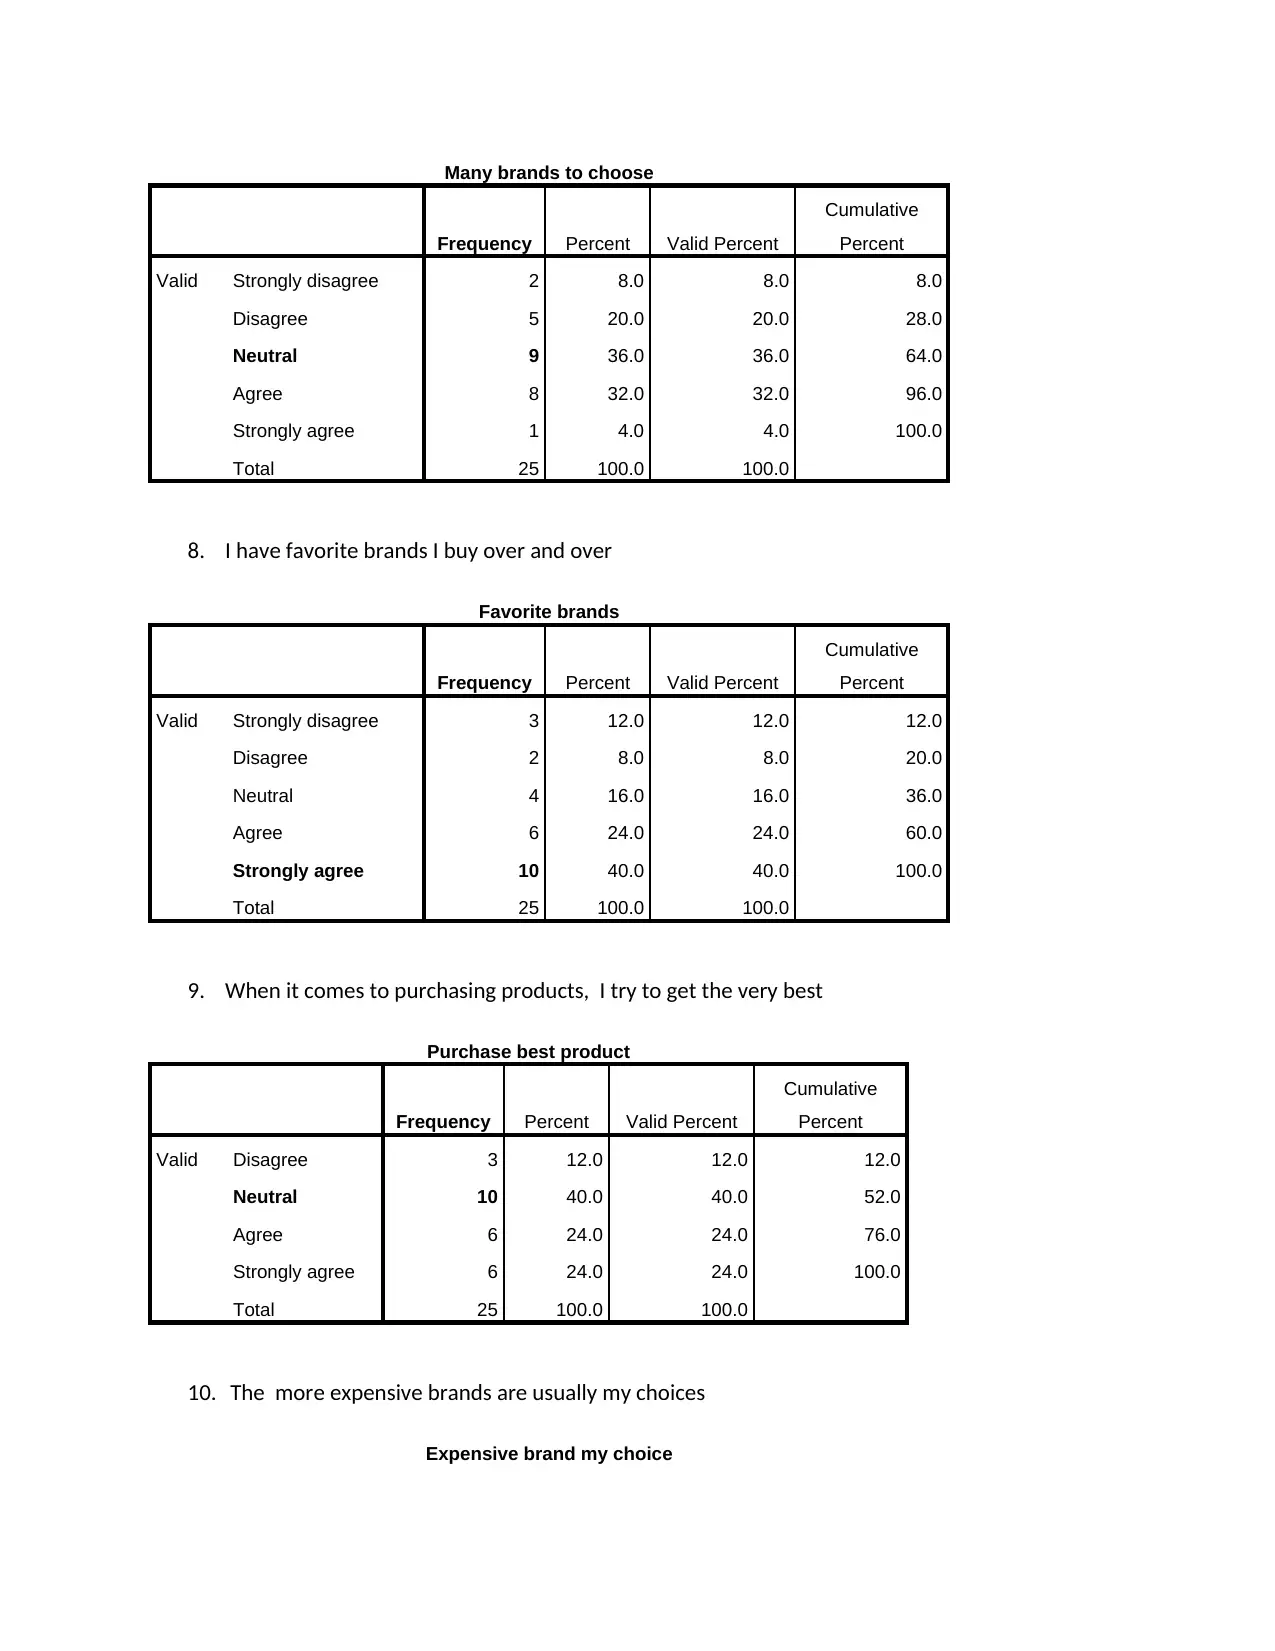
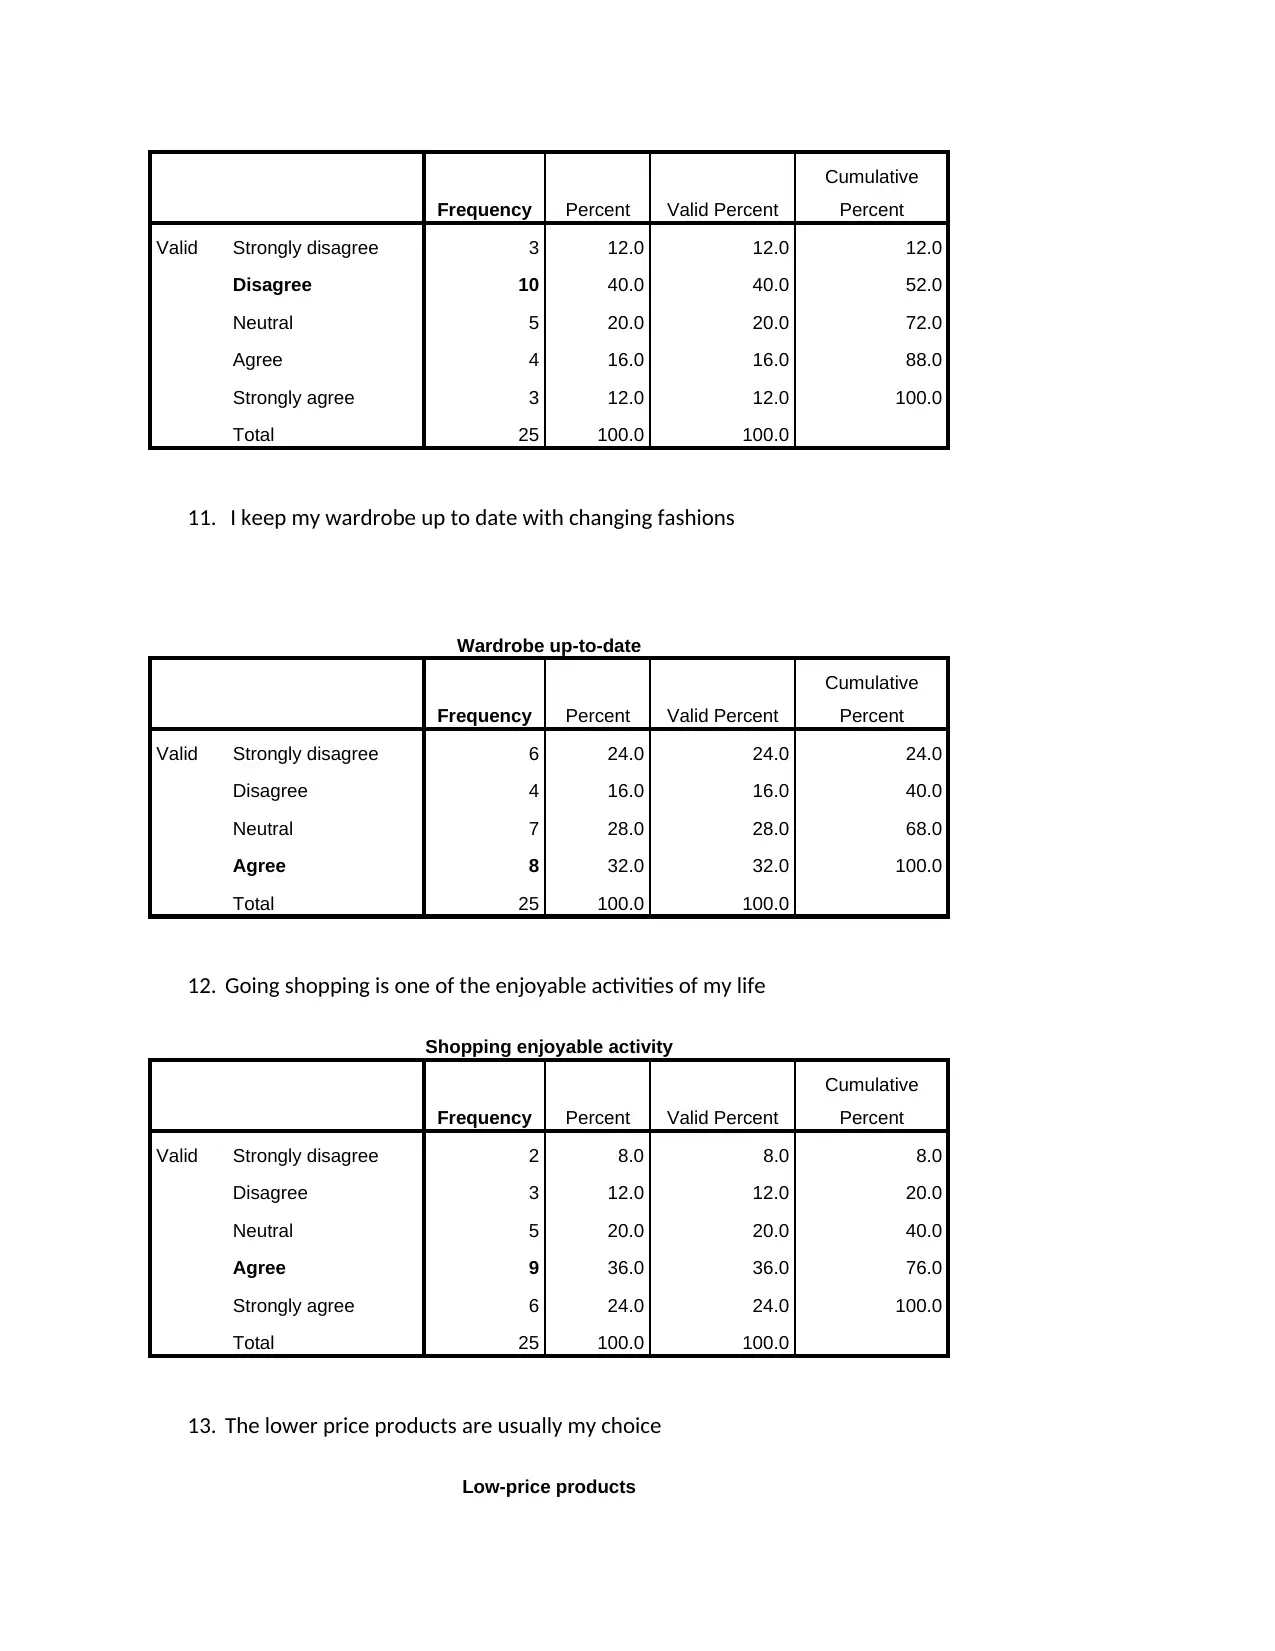
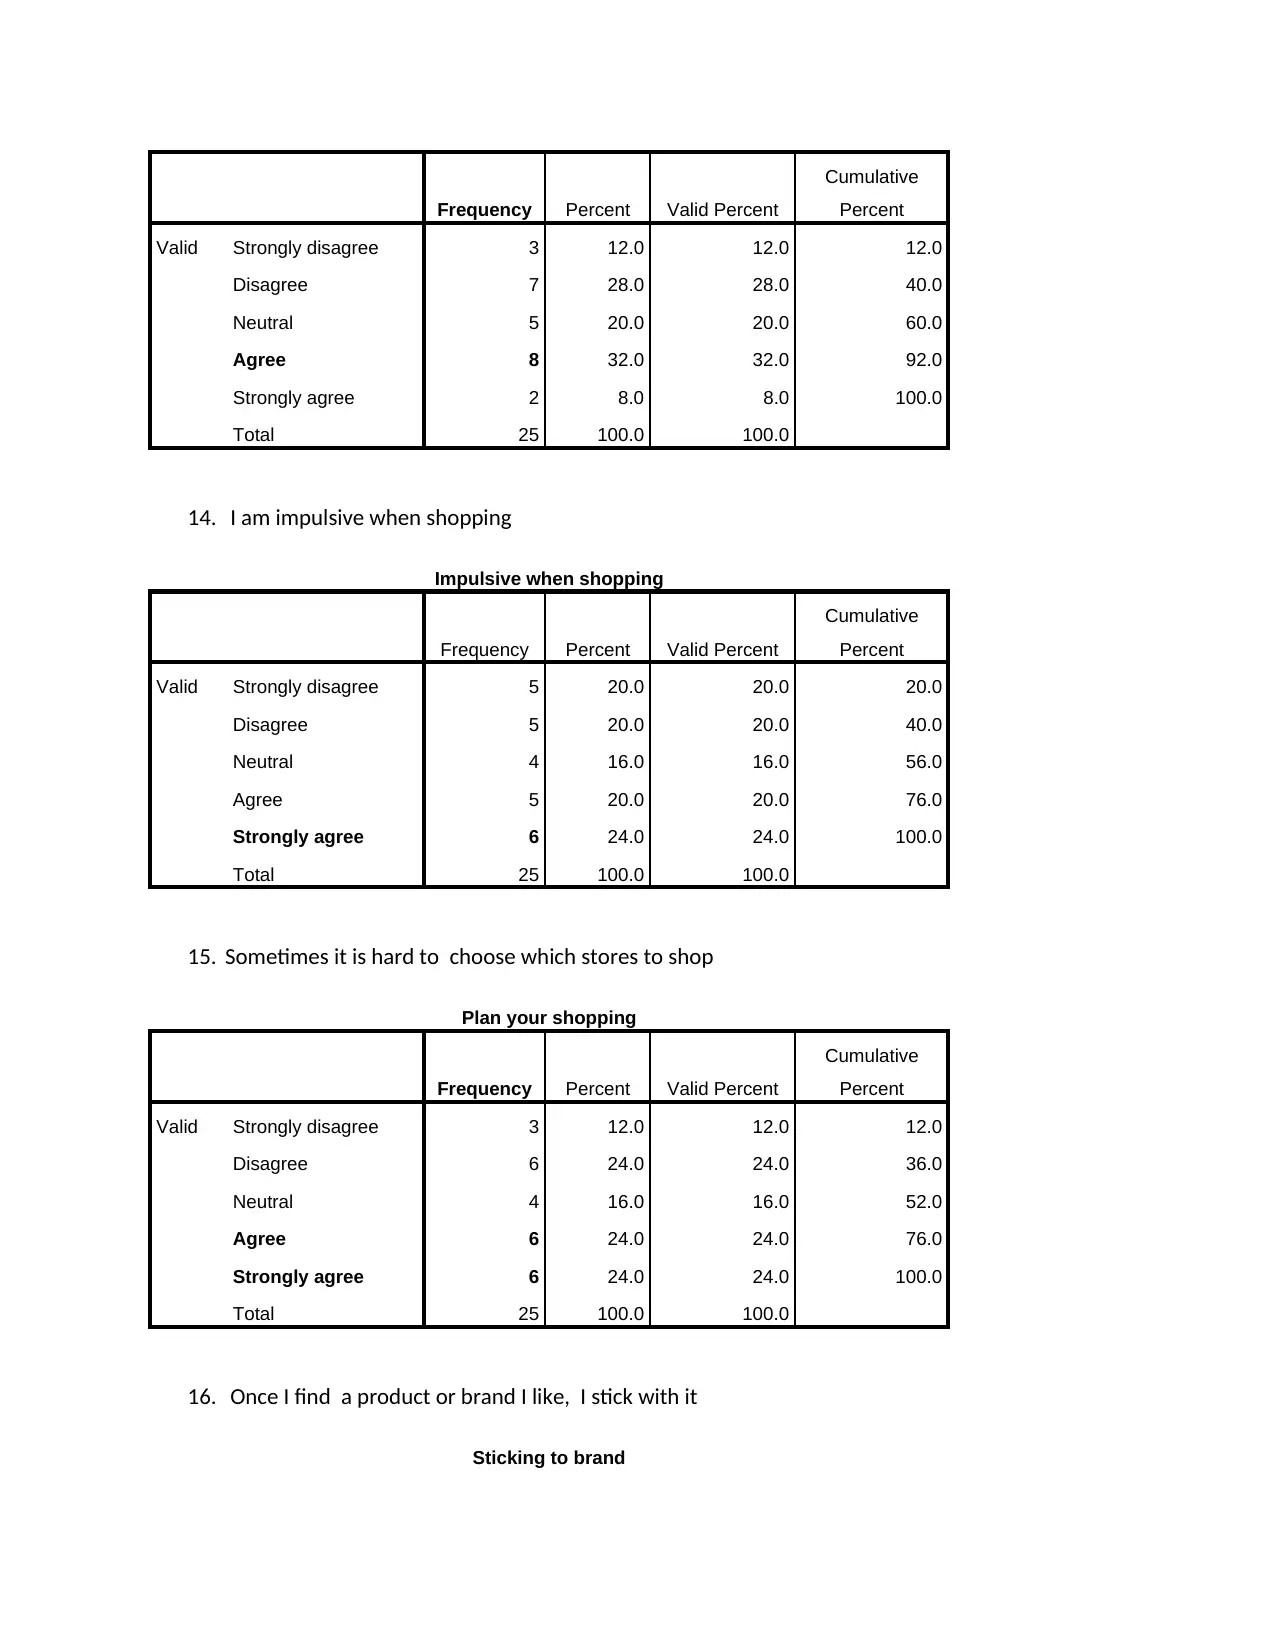
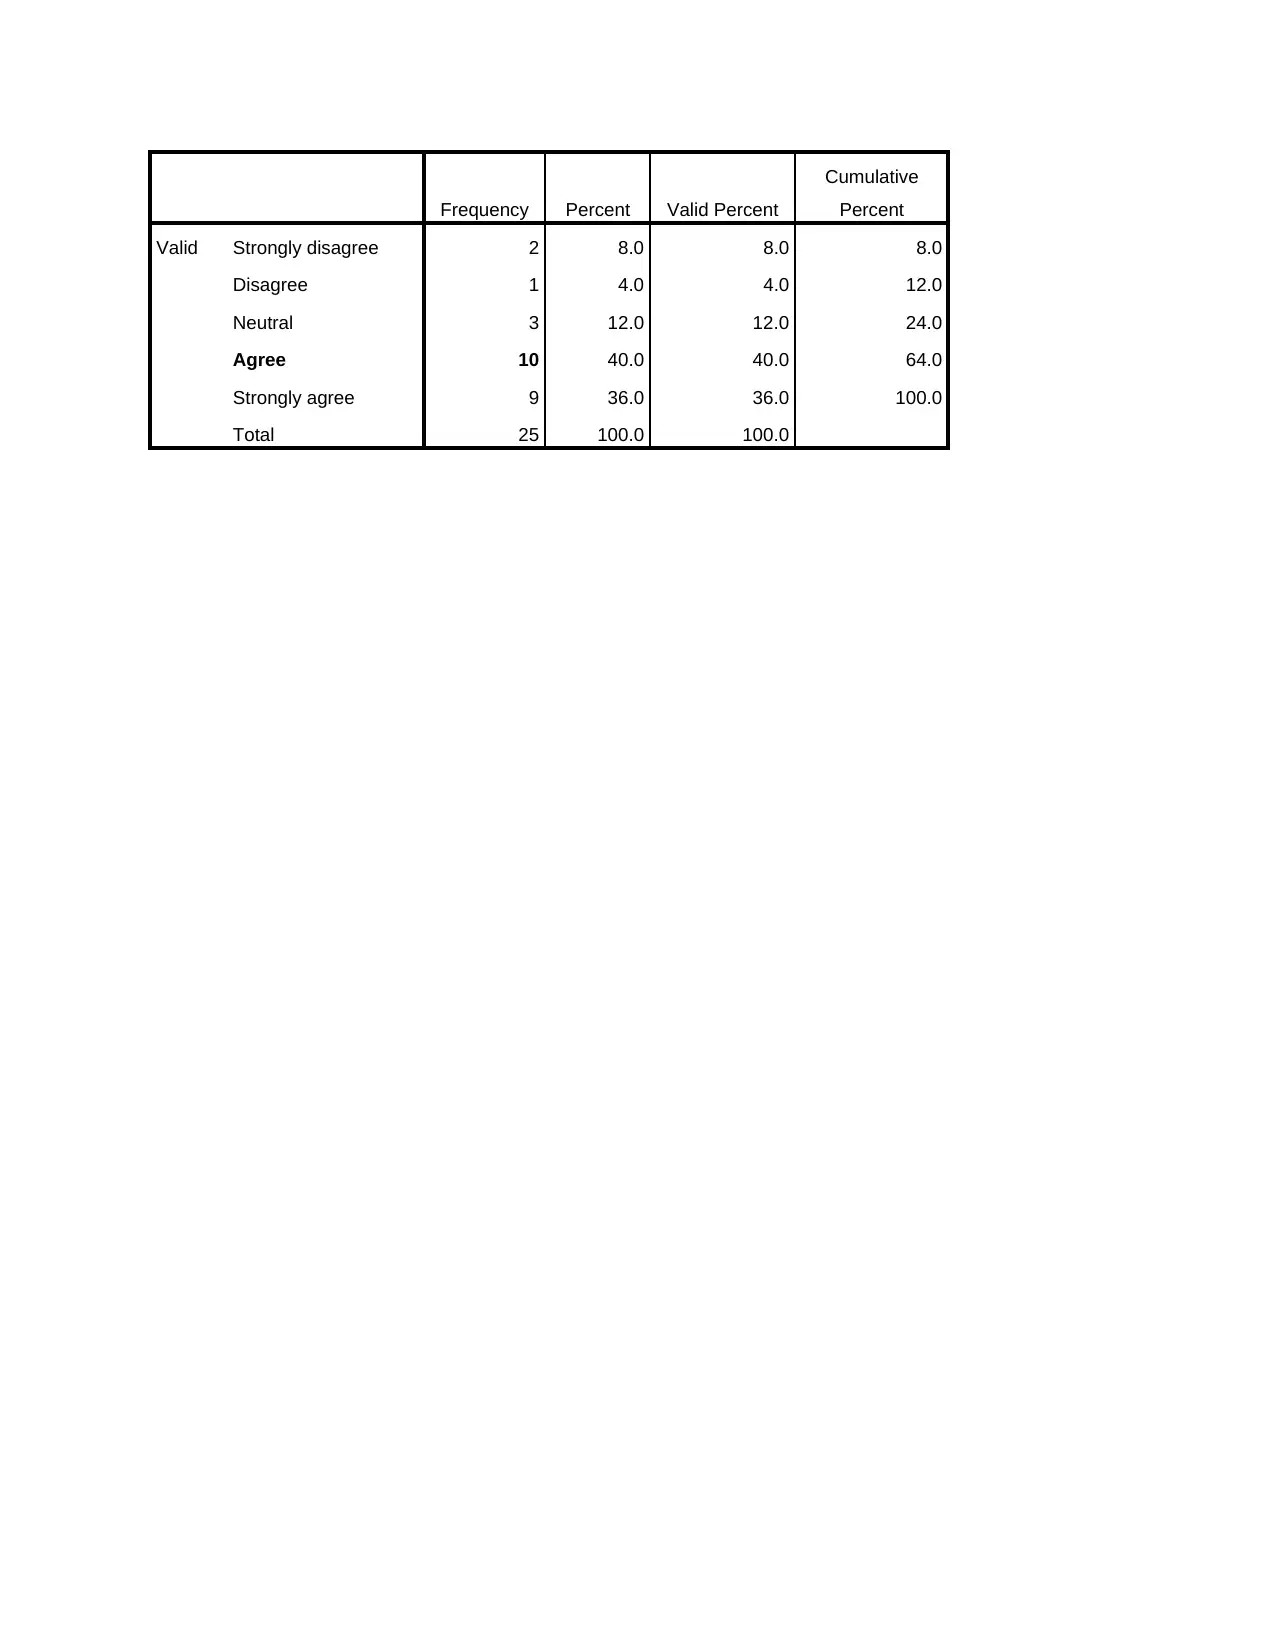
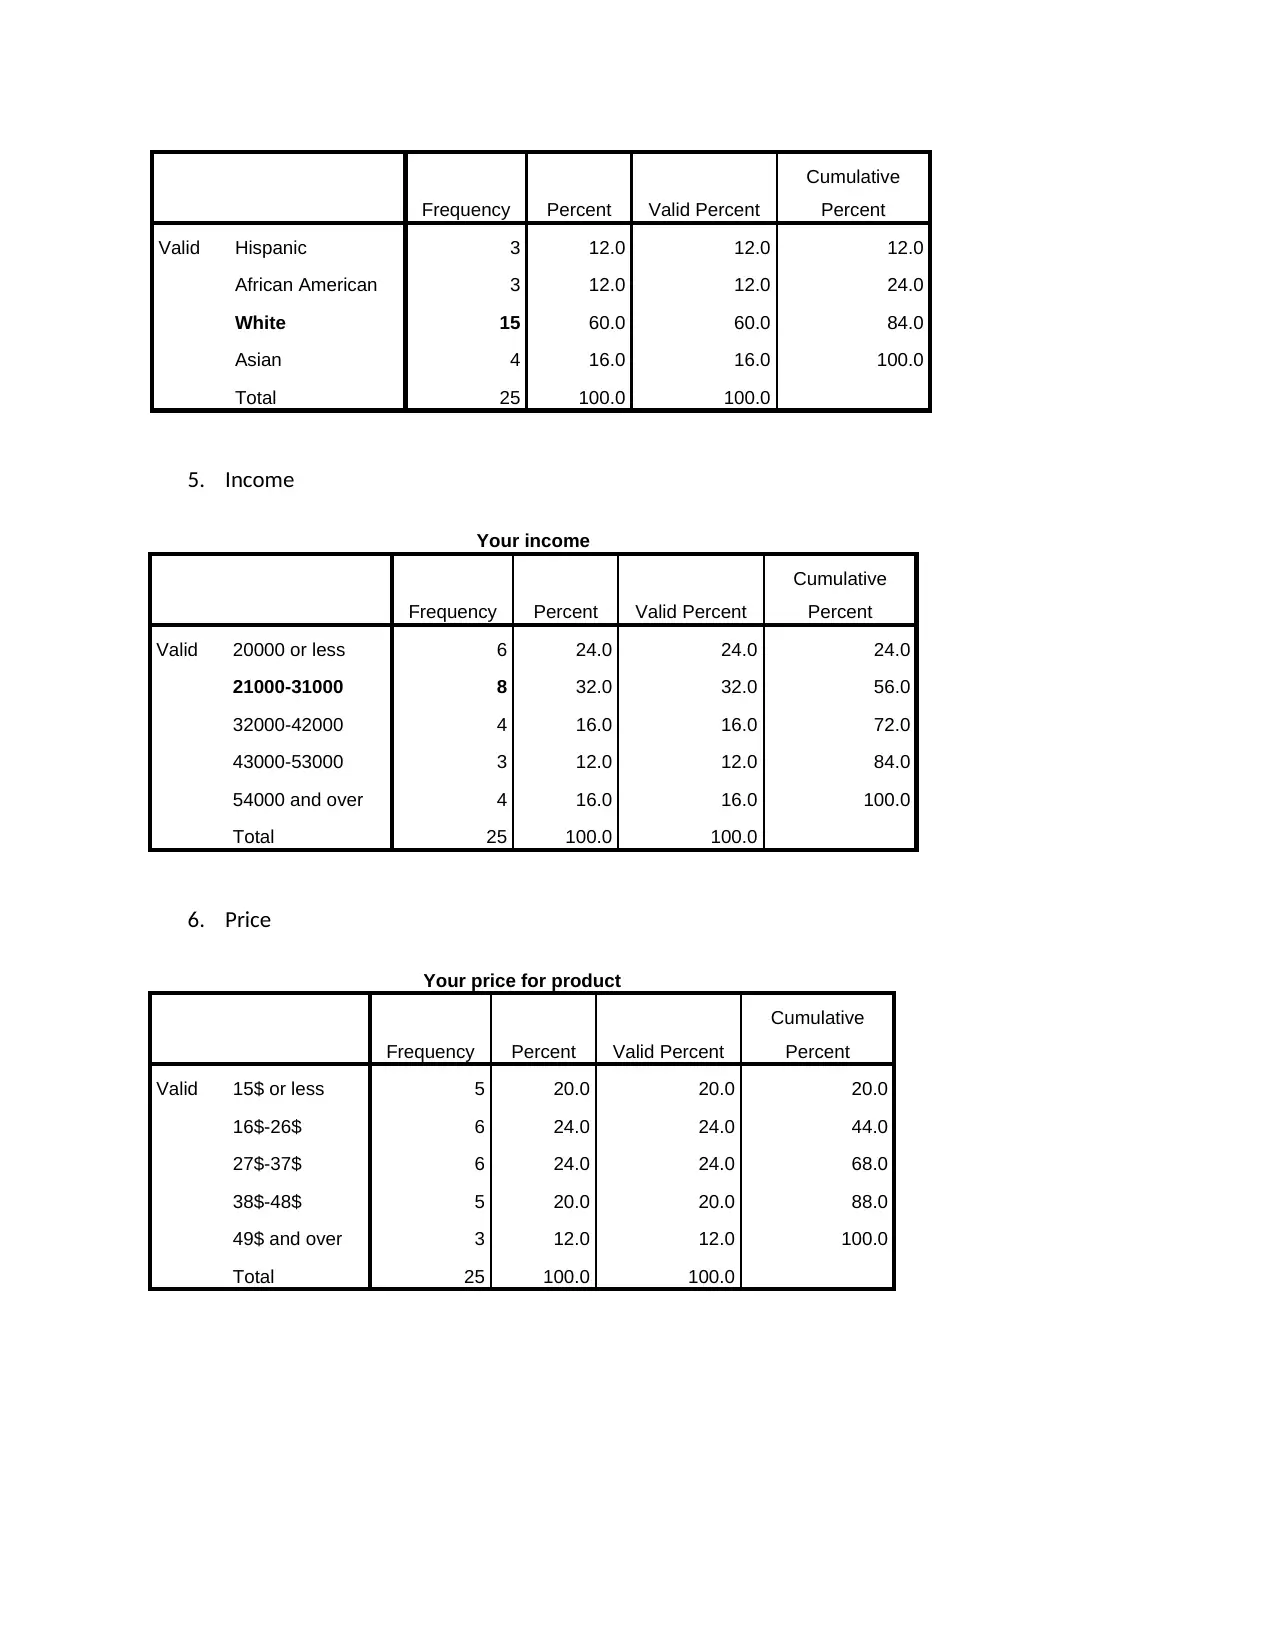
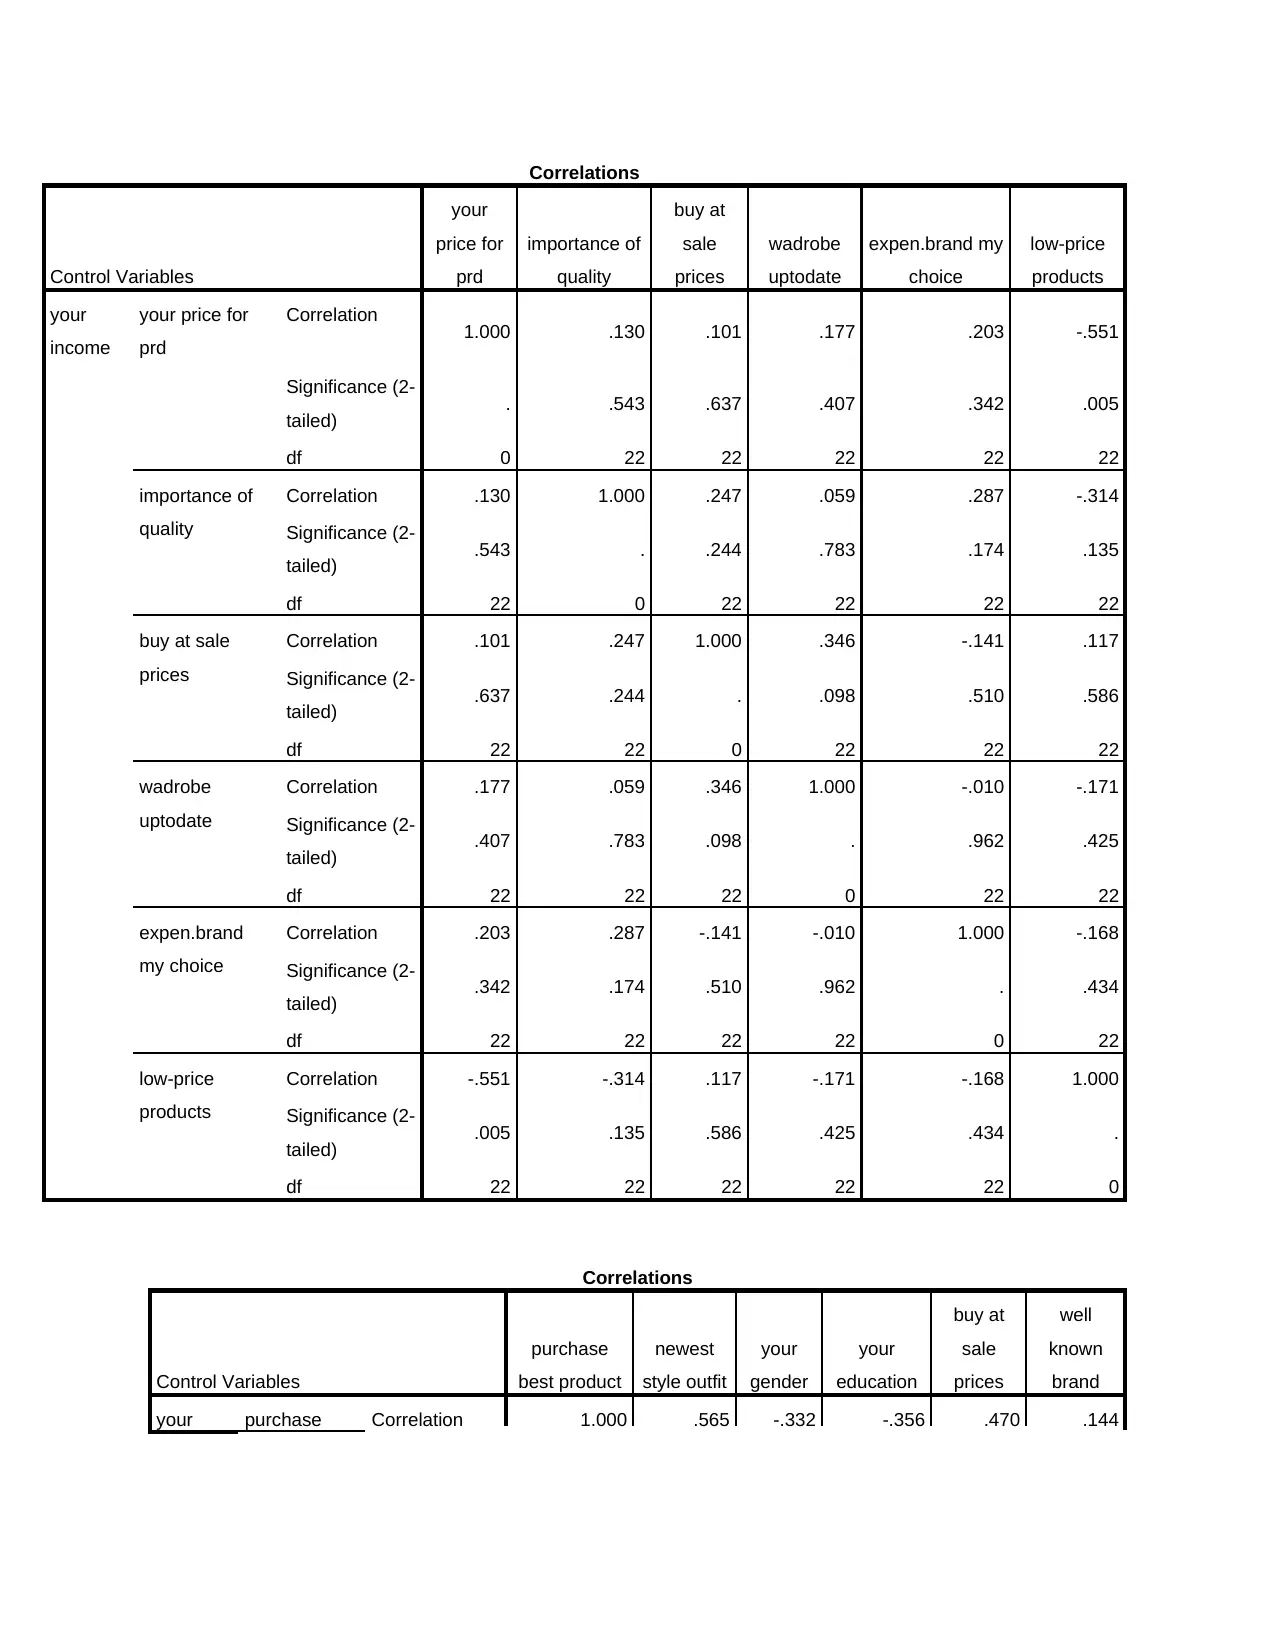
This assignment presents an analysis of a consumer decision-making style inventory, utilizing frequency distributions and correlation analysis to explore various facets of consumer behavior. The inventory delves into aspects such as the importance of quality, brand preference, fashion consciousness, shopping enjoyment, price sensitivity, and impulsiveness. Demographic factors like age, gender, education, ethnicity, and income are also examined to identify potential relationships with consumer decision-making styles. The correlation analysis investigates the relationships between variables such as price perception, brand loyalty, and demographic characteristics, offering insights into the factors that influence consumer choices. The data reveals diverse consumer preferences and behaviors, highlighting the complexity of consumer decision-making processes and the need for targeted marketing strategies. Desklib provides access to similar assignments and study resources for students.
Document Page
Consumer decision making style inventory
1. Getting very good quality is very important to me
Importance of quality
Frequency Percent Valid Percent
Cumulative
Percent
Valid Disagree 1 4.0 4.0 4.0
Agree 11 44.0 44.0 48.0
Strongly agree 13 52.0 52.0 100.0
Total 25 100.0 100.0
2. The well-known national brands are best for me
Well-known brand
Frequency Percent Valid Percent
Cumulative
Percent
Valid Strongly disagree 2 8.0 8.0 8.0
Disagree 3 12.0 12.0 20.0
Neutral 13 52.0 52.0 72.0
Agree 6 24.0 24.0 96.0
Strongly agree 1 4.0 4.0 100.0
Total 25 100.0 100.0
3. I usually have one or more outfits of the very newest style
Newest style outfit
Frequency Percent Valid Percent
Cumulative
Percent
Valid Strongly disagree 2 8.0 8.0 8.0
Disagree 6 24.0 24.0 32.0
Neutral 5 20.0 20.0 52.0
Agree 7 28.0 28.0 80.0
Strongly agree 5 20.0 20.0 100.0
Total 25 100.0 100.0
tabler-icon-diamond-filled.svg

Paraphrase This Document

Need a fresh take? Get an instant paraphrase of this document with our AI Paraphraser
Document Page
4. Shopping is a pleasant activity to me
Pleasant activity
Frequency Percent Valid Percent
Cumulative
Percent
Valid Disagree 3 12.0 12.0 12.0
Neutral 2 8.0 8.0 20.0
Agree 8 32.0 32.0 52.0
Strongly agree 12 48.0 48.0 100.0
Total 25 100.0 100.0
5. I buy as much as possible at the ‘sale’ prices
Buy at sale prices
Frequency Percent Valid Percent
Cumulative
Percent
Valid Disagree 1 4.0 4.0 4.0
Neutral 6 24.0 24.0 28.0
Agree 9 36.0 36.0 64.0
Strongly agree 9 36.0 36.0 100.0
Total 25 100.0 100.0
6. I should plan my shopping more carefully than I do
Plan your shopping
Frequency Percent Valid Percent
Cumulative
Percent
Valid Strongly disagree 3 12.0 12.0 12.0
Disagree 6 24.0 24.0 36.0
Neutral 4 16.0 16.0 52.0
Agree 6 24.0 24.0 76.0
Strongly agree 6 24.0 24.0 100.0
Total 25 100.0 100.0
7. There are so many brands to choose from that I often feel confused
Document Page
Many brands to choose
Frequency Percent Valid Percent
Cumulative
Percent
Valid Strongly disagree 2 8.0 8.0 8.0
Disagree 5 20.0 20.0 28.0
Neutral 9 36.0 36.0 64.0
Agree 8 32.0 32.0 96.0
Strongly agree 1 4.0 4.0 100.0
Total 25 100.0 100.0
8. I have favorite brands I buy over and over
Favorite brands
Frequency Percent Valid Percent
Cumulative
Percent
Valid Strongly disagree 3 12.0 12.0 12.0
Disagree 2 8.0 8.0 20.0
Neutral 4 16.0 16.0 36.0
Agree 6 24.0 24.0 60.0
Strongly agree 10 40.0 40.0 100.0
Total 25 100.0 100.0
9. When it comes to purchasing products, I try to get the very best
Purchase best product
Frequency Percent Valid Percent
Cumulative
Percent
Valid Disagree 3 12.0 12.0 12.0
Neutral 10 40.0 40.0 52.0
Agree 6 24.0 24.0 76.0
Strongly agree 6 24.0 24.0 100.0
Total 25 100.0 100.0
10. The more expensive brands are usually my choices
Expensive brand my choice
Document Page
Frequency Percent Valid Percent
Cumulative
Percent
Valid Strongly disagree 3 12.0 12.0 12.0
Disagree 10 40.0 40.0 52.0
Neutral 5 20.0 20.0 72.0
Agree 4 16.0 16.0 88.0
Strongly agree 3 12.0 12.0 100.0
Total 25 100.0 100.0
11. I keep my wardrobe up to date with changing fashions
Wardrobe up-to-date
Frequency Percent Valid Percent
Cumulative
Percent
Valid Strongly disagree 6 24.0 24.0 24.0
Disagree 4 16.0 16.0 40.0
Neutral 7 28.0 28.0 68.0
Agree 8 32.0 32.0 100.0
Total 25 100.0 100.0
12. Going shopping is one of the enjoyable activities of my life
Shopping enjoyable activity
Frequency Percent Valid Percent
Cumulative
Percent
Valid Strongly disagree 2 8.0 8.0 8.0
Disagree 3 12.0 12.0 20.0
Neutral 5 20.0 20.0 40.0
Agree 9 36.0 36.0 76.0
Strongly agree 6 24.0 24.0 100.0
Total 25 100.0 100.0
13. The lower price products are usually my choice
Low-price products
tabler-icon-diamond-filled.svg

Paraphrase This Document

Need a fresh take? Get an instant paraphrase of this document with our AI Paraphraser
Document Page
Frequency Percent Valid Percent
Cumulative
Percent
Valid Strongly disagree 3 12.0 12.0 12.0
Disagree 7 28.0 28.0 40.0
Neutral 5 20.0 20.0 60.0
Agree 8 32.0 32.0 92.0
Strongly agree 2 8.0 8.0 100.0
Total 25 100.0 100.0
14. I am impulsive when shopping
Impulsive when shopping
Frequency Percent Valid Percent
Cumulative
Percent
Valid Strongly disagree 5 20.0 20.0 20.0
Disagree 5 20.0 20.0 40.0
Neutral 4 16.0 16.0 56.0
Agree 5 20.0 20.0 76.0
Strongly agree 6 24.0 24.0 100.0
Total 25 100.0 100.0
15. Sometimes it is hard to choose which stores to shop
Plan your shopping
Frequency Percent Valid Percent
Cumulative
Percent
Valid Strongly disagree 3 12.0 12.0 12.0
Disagree 6 24.0 24.0 36.0
Neutral 4 16.0 16.0 52.0
Agree 6 24.0 24.0 76.0
Strongly agree 6 24.0 24.0 100.0
Total 25 100.0 100.0
16. Once I find a product or brand I like, I stick with it
Sticking to brand
Document Page
Frequency Percent Valid Percent
Cumulative
Percent
Valid Strongly disagree 2 8.0 8.0 8.0
Disagree 1 4.0 4.0 12.0
Neutral 3 12.0 12.0 24.0
Agree 10 40.0 40.0 64.0
Strongly agree 9 36.0 36.0 100.0
Total 25 100.0 100.0
Document Page
Other categories to the survey instrument
1. Age
Age between
Frequency Percent Valid Percent
Cumulative
Percent
Valid from 18 to 24 8 32.0 32.0 32.0
from 25 to 31 9 36.0 36.0 68.0
from 32 to 38 4 16.0 16.0 84.0
from 39 to 45 3 12.0 12.0 96.0
from 46 and over 1 4.0 4.0 100.0
Total 25 100.0 100.0
2. Gender
Your gender
Frequency Percent Valid Percent
Cumulative
Percent
Valid female 14 56.0 56.0 56.0
male 11 44.0 44.0 100.0
Total 25 100.0 100.0
3. Education
Your education
Frequency Percent Valid Percent
Cumulative
Percent
Valid high school 2 8.0 8.0 8.0
associate degree 11 44.0 44.0 52.0
bachelor degree 7 28.0 28.0 80.0
master’s degree 4 16.0 16.0 96.0
doctorate degree 1 4.0 4.0 100.0
Total 25 100.0 100.0
4. Ethnicity
Your ethnicity
tabler-icon-diamond-filled.svg

Paraphrase This Document

Need a fresh take? Get an instant paraphrase of this document with our AI Paraphraser
Document Page
Frequency Percent Valid Percent
Cumulative
Percent
Valid Hispanic 3 12.0 12.0 12.0
African American 3 12.0 12.0 24.0
White 15 60.0 60.0 84.0
Asian 4 16.0 16.0 100.0
Total 25 100.0 100.0
5. Income
Your income
Frequency Percent Valid Percent
Cumulative
Percent
Valid 20000 or less 6 24.0 24.0 24.0
21000-31000 8 32.0 32.0 56.0
32000-42000 4 16.0 16.0 72.0
43000-53000 3 12.0 12.0 84.0
54000 and over 4 16.0 16.0 100.0
Total 25 100.0 100.0
6. Price
Your price for product
Frequency Percent Valid Percent
Cumulative
Percent
Valid 15$ or less 5 20.0 20.0 20.0
16$-26$ 6 24.0 24.0 44.0
27$-37$ 6 24.0 24.0 68.0
38$-48$ 5 20.0 20.0 88.0
49$ and over 3 12.0 12.0 100.0
Total 25 100.0 100.0
Document Page
Correlations
Correlations
Control Variables
your price for
prd
buy at sale
prices
age between your price for prd Correlation 1.000 .184
Significance (2-tailed) . .390
df 0 22
buy at sale prices Correlation .184 1.000
Significance (2-tailed) .390 .
df 22 0
Correlations
Control Variables
wadrobe
uptodate
low-price
products
hard to
chooose
store
sticking
to brand
impulsive
when
shopping
age
between
wadrobe
uptodate
Correlation 1.000 -.160 .042 .555 -.015
Significance
(2-tailed) . .455 .845 .005 .946
df 0 22 22 22 22
low-price
products
Correlation -.160 1.000 .288 .114 -.131
Significance
(2-tailed) .455 . .172 .597 .540
df 22 0 22 22 22
hard to
chooose
store
Correlation .042 .288 1.000 .152 .179
Significance
(2-tailed) .845 .172 . .480 .402
df 22 22 0 22 22
sticking to
brand
Correlation .555 .114 .152 1.000 .086
Significance
(2-tailed) .005 .597 .480 . .690
df 22 22 22 0 22
impulsive
when
shopping
Correlation -.015 -.131 .179 .086 1.000
Significance
(2-tailed) .946 .540 .402 .690 .
df 22 22 22 22 0
Document Page
Correlations
Control Variables
your
price for
prd
importance of
quality
buy at
sale
prices
wadrobe
uptodate
expen.brand my
choice
low-price
products
your
income
your price for
prd
Correlation 1.000 .130 .101 .177 .203 -.551
Significance (2-
tailed) . .543 .637 .407 .342 .005
df 0 22 22 22 22 22
importance of
quality
Correlation .130 1.000 .247 .059 .287 -.314
Significance (2-
tailed) .543 . .244 .783 .174 .135
df 22 0 22 22 22 22
buy at sale
prices
Correlation .101 .247 1.000 .346 -.141 .117
Significance (2-
tailed) .637 .244 . .098 .510 .586
df 22 22 0 22 22 22
wadrobe
uptodate
Correlation .177 .059 .346 1.000 -.010 -.171
Significance (2-
tailed) .407 .783 .098 . .962 .425
df 22 22 22 0 22 22
expen.brand
my choice
Correlation .203 .287 -.141 -.010 1.000 -.168
Significance (2-
tailed) .342 .174 .510 .962 . .434
df 22 22 22 22 0 22
low-price
products
Correlation -.551 -.314 .117 -.171 -.168 1.000
Significance (2-
tailed) .005 .135 .586 .425 .434 .
df 22 22 22 22 22 0
Correlations
Control Variables
purchase
best product
newest
style outfit
your
gender
your
education
buy at
sale
prices
well
known
brand
your purchase Correlation 1.000 .565 -.332 -.356 .470 .144
tabler-icon-diamond-filled.svg

Paraphrase This Document

Need a fresh take? Get an instant paraphrase of this document with our AI Paraphraser
Document Page
income best product Significance
(2-tailed) . .004 .113 .088 .020 .501
df 0 22 22 22 22 22
newest style
outfit
Correlation .565 1.000 -.131 -.242 -.002 .020
Significance
(2-tailed) .004 . .542 .254 .991 .926
df 22 0 22 22 22 22
your gender Correlation -.332 -.131 1.000 .172 -.713 -.197
Significance
(2-tailed) .113 .542 . .421 .000 .356
df 22 22 0 22 22 22
your
education
Correlation -.356 -.242 .172 1.000 -.022 -.147
Significance
(2-tailed) .088 .254 .421 . .920 .493
df 22 22 22 0 22 22
buy at sale
prices
Correlation .470 -.002 -.713 -.022 1.000 -.049
Significance
(2-tailed) .020 .991 .000 .920 . .820
df 22 22 22 22 0 22
well known
brand
Correlation .144 .020 -.197 -.147 -.049 1.000
Significance
(2-tailed) .501 .926 .356 .493 .820 .
df 22 22 22 22 22 0
Document Page
Corr
elati
ons
Control Variables
sti
ck
in
g
to
br
an
d
ha
rd
to
ch
oo
os
e
sto
re
im
pul
siv
e
wh
en
sh
op
pin
g
lo
w-
pri
ce
pr
od
uct
s
shop.
enjoy
able
activ.
wa
dr
ob
e
upt
od
ate
exp
en.b
rand
my
choi
ce
pur
ch
as
e
be
st
pro
du
ct
fa
vo
rit
e
br
an
ds
m
an
y
br
an
ds
to
ch
oo
se
b
u
y
at
s
al
e
p
ri
c
e
s
pla
n
yo
ur
sh
op
pin
g
n
e
w
es
t
st
yl
e
o
ut
fit
ple
as
an
t
act
ivit
y
w
el
l
k
n
o
w
n
br
a
n
d
ag
e
be
tw
ee
n
yo
ur
g
e
n
d
er
yo
ur
ed
uc
ati
on
yo
ur
et
hn
icit
y
y
o
u
r
p
ri
c
e
f
o
r
p
r
d
imp
orta
nce
of
qual
ity
your
inco
me
sticki
ng to
bran
d
Corr
elati
on
1.
00
0
.1
12
-.0
24
.1
19 .303 .54
9 .290 .43
0
.7
26
.0
09
.5
3
1
.08
6
.2
9
1
-.0
08
.2
4
8
.0
58
-.
6
1
8
-.1
50
-.2
12
.
2
1
0
-.12
0
Sign
ifica
nce
(2-
taile
d)
. .6
02
.91
1
.5
81 .149 .00
5 .170 .03
6
.0
00
.9
67
.0
0
8
.69
0
.1
6
8
.9
69
.2
4
3
.7
87
.0
0
1
.48
5
.3
21
.
3
2
5
.57
7
df 0 22 22 22 22 22 22 22 22 22 2
2 22 2
2 22 2
2 22 2
2 22 22 2
2 22
hard
to
choo
ose
store
Corr
elati
on
.1
12
1.
00
0
.04
6
.3
05 .026 -.1
03 .039 -.0
24
.1
64
.3
75
-.
0
1
0
.24
4
.0
6
4
-.0
68
-.
1
8
5
.0
07
.1
1
8
.22
5
-.1
21
-.
1
9
3
-.19
7
Sign
ifica
nce
(2-
taile
d)
.6
02
. .83
2
.1
47
.905 .63
3
.858 .91
3
.4
44
.0
71
.9
6
3
.25
0
.7
6
7
.7
51
.3
8
8
.9
75
.5
8
4
.29
0
.5
73
.
3
6
5
.35
6
chevron_up_icon
1 out of 34
circle_padding
hide_on_mobile
zoom_out_icon
[object Object]