MATI3006 Numeracy 1 Coursework Brief Spring 2018
VerifiedAdded on 2023/06/13
|31
|7153
|462
AI Summary
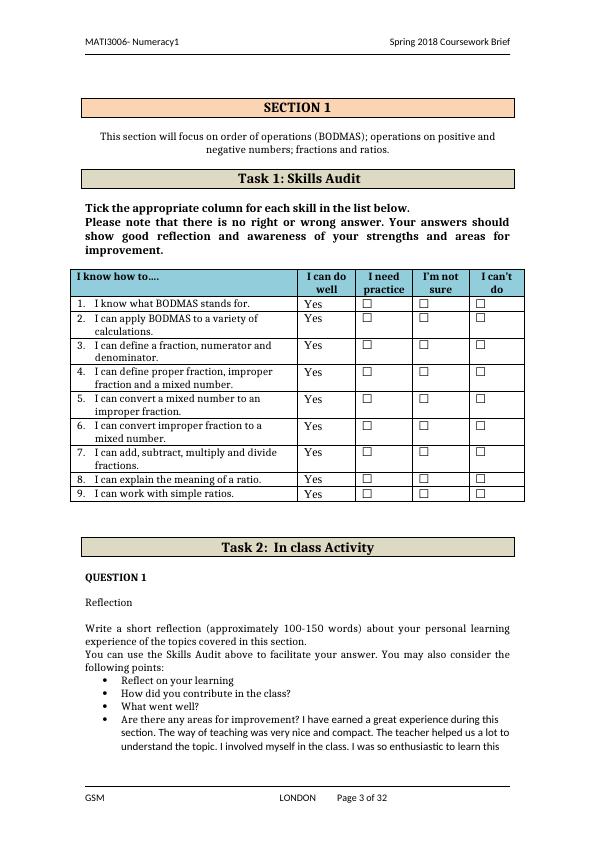
This coursework brief covers order of operations, decimals, percentages, index numbers, introduction to statistics and graphical representation of data. It includes a skills audit, in-class activity, online activity, and 13 questions. The learning outcomes assessed are applying numerical skills, demonstrating an ability to calculate and interpret statistical values, and interpreting and processing mathematical problems in personal and professional contexts. The coursework is worth 100% of the total marks for this module.
Contribute Materials
Your contribution can guide someone’s learning journey. Share your
documents today.

MATI3006
Numeracy 1
Spring 2018
Coursework/Portfolio Brief
Deadline for Submission: [Week 11, 2pm Wed 25th
April,2018]
Submit this coursework through the Student Portal with a Turn-it-in Report
Learning outcomes assessed:
Apply numerical skills, concepts and techniques in a variety of business and academic
contexts.
Demonstrate an ability to calculate and interpret statistical values.
Be able to interpret and process mathematical problems in personal and professional
contexts.
This coursework is worth 100% of the total marks for this module.
Secure Best Marks with AI Grader
Need help grading? Try our AI Grader for instant feedback on your assignments.

MATI3006- Numeracy1 Spring 2018 Coursework Brief
Coursework Instructions
Please read carefully
• Carefully read the module handbook, the marking criteria and the grade
descriptors.
Academic Misconduct
You are responsible for ensuring you understand the policy and regulations about
academic misconduct. You must:
Complete your assessment work alone except where required or allowed by
the assignment briefing paper and ensure it has not been written or
composed by or with the assistance of any other person.
Make sure all sentences or passages quoted from other people’s work in
this assignment are in quotation marks, and are specifically acknowledged
by reference to the author, work and page.
Failure to provide references may constitute plagiarism which is a serious
academic offence.
Should you submit work that is similar or identical in content to that of
another classmate, you could be guilty of collusion. This is also a serious
academic offence.
Plagiarism, collusion, buying assessments and all other forms of cheating
will not be tolerated. Serious academic misconduct can result in your
withdrawal from the programme and being required to leave the college.
Also note that proven academic misconduct is usually required to be reported to
relevant professional bodies and in some cases prospective employers which may
prevent even a successful student from being admitted into their desired
profession.
If you are unsure about how to complete your assessment, you should seek advice
from your Module tutor and/or Module Leader.
For support and/or clarification regarding referencing and using sources in your
work, ask your tutors for guidance and/or the Library team.
Guidance on GSM Learn:
https://learn.gsm.org.uk/course/view.php?id=293#section-4
Further help:
library@gsmlondon.ac.uk
This portfolio consists of four sections:
GSM LONDON Page 1 of 32

MATI3006- Numeracy1 Spring 2018 Coursework Brief
Sections 1, 2 and 3 are assessed in ‘pass/fail’ criteria. Sections 1, 2 and 3 combined
are worth 39% of the final mark.
Sections 1, 2 and 3 each consist of 3 tasks:
Task 1 – Skills Audit
Task 2 – In class Activity
Task 3 – Online Activity -students are expected to complete and pass (40%)
relevant online activity/quiz. The results page will need to be saved (screenshot)
and inserted under a relevant area of the portfolio.
Section 4 is worth 61% of the final mark and consists of 13 questions.
Students are required to complete all questions and tasks set out in this
portfolio.
GSM LONDON Page 2 of 32
Task 1 Task 2 Task 3 Total
Part
1
Section 1 Pass/Fail
(Skills Audit)
3%
Pass/Fail
(In class
activity)
5%
Pass/Fail
(Online Activity)
5%
39 %
Section 2 Pass/Fail
(Skills Audit)
3%
Pass/Fail
(In class
activity)
5%
Pass/Fail
(Online Activity)
5%
Section 3 Pass/Fail
(Skills Audit)
3%
Pass/Fail
(In class
activity)
5%
Pass/Fail
(Online Activity)
5%
Part
2 Section 4 61%
(13 questions) N/A N/A 61%
100%

MATI3006- Numeracy1 Spring 2018 Coursework Brief
SECTION 1
This section will focus on order of operations (BODMAS); operations on positive and
negative numbers; fractions and ratios.
Task 1: Skills Audit
Tick the appropriate column for each skill in the list below.
Please note that there is no right or wrong answer. Your answers should
show good reflection and awareness of your strengths and areas for
improvement.
I know how to…. I can do
well
I need
practice
I’m not
sure
I can’t
do
1. I know what BODMAS stands for. Yes ☐ ☐ ☐
2. I can apply BODMAS to a variety of
calculations.
Yes ☐ ☐ ☐
3. I can define a fraction, numerator and
denominator.
Yes ☐ ☐ ☐
4. I can define proper fraction, improper
fraction and a mixed number.
Yes ☐ ☐ ☐
5. I can convert a mixed number to an
improper fraction.
Yes ☐ ☐ ☐
6. I can convert improper fraction to a
mixed number.
Yes ☐ ☐ ☐
7. I can add, subtract, multiply and divide
fractions.
Yes ☐ ☐ ☐
8. I can explain the meaning of a ratio. Yes ☐ ☐ ☐
9. I can work with simple ratios. Yes ☐ ☐ ☐
Task 2: In class Activity
QUESTION 1
Reflection
Write a short reflection (approximately 100-150 words) about your personal learning
experience of the topics covered in this section.
You can use the Skills Audit above to facilitate your answer. You may also consider the
following points:
Reflect on your learning
How did you contribute in the class?
What went well?
Are there any areas for improvement? I have earned a great experience during this
section. The way of teaching was very nice and compact. The teacher helped us a lot to
understand the topic. I involved myself in the class. I was so enthusiastic to learn this
GSM LONDON Page 3 of 32
Secure Best Marks with AI Grader
Need help grading? Try our AI Grader for instant feedback on your assignments.

MATI3006- Numeracy1 Spring 2018 Coursework Brief
useful and fundamental mathematical tool. The teacher asked some questions related
to the topic. I was able to answer those questions successfully and correctly. Some of
my friends seek my help for better understanding of the topic. I was proud about the
fact that I was able to make them understand this interesting topic. I do not need any
improvement in any particular area of this topic. I need to practice this particular tool
several times to solve the mathematical problems using this tool more quickly.
It is necessary for educators to understand which procedures are used by the students.
Different students use different process to solve the problem (Ung et al. 2017).
QUESTION 2
Give one example of a ‘real-life’ problem or situation that involves one (or more) of the
following topics:
Order of operations
Operations on positive and negative numbers
Fractions
Ratios
Also, please find a solution to the problem you described.
Mr. Lewis purchased mangoes for his son and daughter. He purchased 21 mangoes. It
was seen that 6 mangoes were defected. Then, he decided to distribute the rest mangoes
between his son and daughter. He distributed the mangoes between his son and daughter
in the ratio 1:2. How many mangoes each of them got?
Solution:
The son got (21-6)/3 =5 mangoes and the daughter got (21-6)*2/3=10 mangoes.
BODMAS rule is used to solve some problems. Using this method problems can be
solved easily (Holland, Mast and Haworth 2017)
Task 3: Online Activity
Evidence (screenshot) of completing and passing relevant online quiz/activity.
Instruction:
1. Complete your online quiz/activity, (GSM Learn).
2. Take a screenshot.
3. Copy and paste the screenshot here..
GSM LONDON Page 4 of 32

MATI3006- Numeracy1 Spring 2018 Coursework Brief
GSM LONDON Page 5 of 32

MATI3006- Numeracy1 Spring 2018 Coursework Brief
GSM LONDON Page 6 of 32
Paraphrase This Document
Need a fresh take? Get an instant paraphrase of this document with our AI Paraphraser

MATI3006- Numeracy1 Spring 2018 Coursework Brief
GSM LONDON Page 7 of 32

MATI3006- Numeracy1 Spring 2018 Coursework Brief
SECTION 2
This section will focus on decimals, percentages and index numbers.
Task 1: Skills Audit
Tick the appropriate column for each skill in the list below.
Please note that there is no right or wrong answer. Your answers should
show good reflection and awareness of your strengths and areas for
improvement.
I know how to…. I can do
well
I need
practice
I’m not
sure
I can’t
do
GSM LONDON Page 8 of 32

MATI3006- Numeracy1 Spring 2018 Coursework Brief
10. I can describe the relationship between
fractions, decimals and percentages.
Yes ☐ ☐ ☐
11. I can identify the decimal equivalent of a
percent.
Yes ☐ ☐ ☐
12. I can identify the fractional equivalent of
a percent.
Yes ☐ ☐ ☐
13. I can determine which concepts and
procedures are needed to complete each
practice exercise.
Yes ☐ ☐ ☐
14. I can compute answers by applying
appropriate formulas and procedures.
Yes ☐ ☐ ☐
15. I can construct a simple index. Yes ☐ ☐ ☐
16. I can interpret indexes to identify trends
in a data set.
Yes ☐ ☐ ☐
Task 2: In class Activity
QUESTION 1
Reflection
Write a short reflection (approximately 100-150 words) about your personal learning
experience of the topics covered in this section.
You can use the Skills Audit above to facilitate your answer. You may also consider the
following points:
Reflect on your learning
How did you contribute in the class?
What went well?
Are there any areas for improvement? I was very excited to attain this class. It was
very important topic to learn. In this chapter, we learn a lot about the relationship
between fraction, decimal and percentage. The teacher taught us the topic with
GSM LONDON Page 9 of 32
Secure Best Marks with AI Grader
Need help grading? Try our AI Grader for instant feedback on your assignments.

MATI3006- Numeracy1 Spring 2018 Coursework Brief
special care. It was very difficult to understand at the first time. Then, the teacher
helped me a lot to understand the topic. I had tried to answer the questions asked in
the classroom. I was facing trouble in establishing the relationship between fraction
and decimal. Some of my friends helped me a lot to understand the topic. I need to
solve these types of problems to develop my understanding.
QUESTION 2
Give one example of a ‘real-life’ problem or situation that involves one (or more) of the
following topics:
Decimals
Percentages
Index numbers
Also, please find a solution to the problem you described.
It is necessary to provide a real-life example of the above mentioned topic. It was
assume that the sales of a company were £150.0 billion in the year 2011 and it was
£265.75 billion in the year 2017. Therefore, it was important to calculate the relative
index.
Solution: The sales were £150.0 billion in the year 2011. Therefore, the base year for
the problem was 2011. The sales of the company were £265.75 billion in the year 2017.
Hence, the relative index is defined as (265.75-150.0)*100/150.0 = 77.17
These decimal can be converted to fraction. It will be (7717/100)
It is very important to understand the concept of decimal and fraction numbers. It is
very difficult to understand the concept (Wheeler and Champion 2016).
Task 3: Online Activity
Evidence (screenshot) of completing and passing relevant online quiz/activity
Instruction:
4. Complete your online quiz/activity, (GSM Learn).
5. Take a screenshot.
6. Copy and paste the screenshot here.
GSM LONDON Page 10 of 32

MATI3006- Numeracy1 Spring 2018 Coursework Brief
SECTION 3
This section will focus on introduction to statistics (mean, median, mode and range) and
graphical representation of data.
Task 1: Skills Audit
Tick the appropriate column for each skill in the list below.
Please note that there is no right or wrong answer. Your answers should
show good reflection and awareness of your strengths and areas for
improvement.
I know how to…. I can do
well
I need
practice
I’m not
sure
I can’t
do
17. I know how to calculate a mean. Yes ☐ ☐ ☐
18. I know how to calculate a median. Yes ☐ ☐ ☐
19. I know how to calculate a mode. Yes ☐ ☐ ☐
20. I know how to calculate range. Yes ☐ ☐ ☐
GSM LONDON Page 11 of 32

MATI3006- Numeracy1 Spring 2018 Coursework Brief
21. I understand the statistical implications
of mean, median, mode and range.
Yes ☐ ☐ ☐
22. I can define a line graph, bar chart and a
pie chart.
Yes ☐ ☐ ☐
23. I can interpret and analyse graphs
presented to determine what information
is given.
Yes ☐ ☐ ☐
24. I can construct a simple line graph and
bar chart.
Yes ☐ ☐ ☐
Task 2: In class Activity
QUESTION 1
Reflection
Write a short reflection (approximately 100-150 words) about your personal learning
experience of the topics covered in this section.
You can use the Skills Audit above to facilitate your answer. You may also consider the
following points:
Reflect on your learning
How did you contribute in the class?
What went well?
Are there any areas for improvement? This was a very important class. We learn the
fundamental concepts of statistics. The topic was very interesting. Our respected
teacher taught us this topic very carefully. It was totally a new concept to us. Hence, I
needed some times to grip the concept. I asked lot of things during the class. I really
loved to plot the graphs. I enjoyed the thing how to interpret results using bar charts,
line diagram etc. I think I need some improvements. I need to work with more real-life
GSM LONDON Page 12 of 32
Paraphrase This Document
Need a fresh take? Get an instant paraphrase of this document with our AI Paraphraser

MATI3006- Numeracy1 Spring 2018 Coursework Brief
data. Sometimes, it becomes difficult to find out the mean and median of a big data
set.
QUESTION 2
Give one example of a ‘real-life’ problem or situation that involves one (or more) of the
following topics:
Introduction to statistics (mean, median, mode and range)
Graphical representation of data
Also, please find a solution to the problem you described.
The average temperatures of London are provided for different months. This data can
be shown graphically.
Month
Temperat
ure
January 5.9
Februar
y 6
March 8
April 9.9
May 13.3
June 16.2
July 18.6
August 18.6
Septem
ber 15.9
October 12.4
Novemb
er 8.7
Decemb
er 6.9
Solution: Mean of the temperature=
(5.9+6+8+9.9+13.3+16.2+18.6+18.6+15.9+12.4+8.7+6.9)/12 = 11.7
The data should be arranged in increasing order. Hence, the arranged data will be 5.9, 6,
6.9, 8, 8.7, 9.9, 12.4, 13.3, 15.9, 16.2, 18.6, and 18.6. Total number of observations =
12.
Hence, the mean of (12/2) = 6th and (12/2) +1 =7th observation is defined as median.
Therefore, the median = (9.9+12.4)/2 = 11.15
Frequency of 18.6 is 2 and frequency of other observations are 1.
Hence, mode = 18.6.
GSM LONDON Page 13 of 32

MATI3006- Numeracy1 Spring 2018 Coursework Brief
Minimum value of the data set is 5.9 and maximum value of the observation is 18.6.
Hence range of the data is = (18.6-5.9) = 12.7.
January
February
March
April
May
June
July
Auguest
September
October
November
December
5.9 6
8
9.9
13.3
16.2
18.6 18.6
15.9
12.4
8.7
6.9
Average temperature for different
months in London
Figure: Average temperature for different months in London
Source: Created by author
Descriptive statistics are used to get the basic idea about the data. The data can be
graphically represented (Mendenhall and Sincich 2016).
Task 3: Online Activity
Evidence (screenshot) of completing and passing relevant online quiz/activity.
Instruction:
1. Complete your online quiz/activity, (GSM Learn).
2. Take a screenshot.
GSM LONDON Page 14 of 32

MATI3006- Numeracy1 Spring 2018 Coursework Brief
3. Copy and paste the screenshot here. .
SECTION 4
QUESTION 1 [4 marks]
A mobile phone outlet has a selection of different brands for sale. 1
3 of the mobiles are
Samsung, 0.4 are iPhone, and the rest are HTC.
a) What fraction of the mobiles is HTC?
b) If there are 180 mobiles altogether, how many of each brand is in the outlet?
Answer (type your answer and calculations here):(a) 4/15 of the total mobiles are the
mobile of HTC brand.
GSM LONDON Page 15 of 32
Secure Best Marks with AI Grader
Need help grading? Try our AI Grader for instant feedback on your assignments.

MATI3006- Numeracy1 Spring 2018 Coursework Brief
Calculation: 1/3 of the mobiles are Samsung. 0.4 of total mobiles are i-phones.
0.4=4/10=2/5. It is assumed that total proportion is 1. Hence, the mobiles of HTC brand
= 1-(1/3 + 2/5) [It is to be noted that the L.C.F of 5 and 3 is (5*3) =15]
=1- ( 15
3 ) +(( 15
5 )∗2)
15
=1- 5+(3∗2)
15
=1- 11
15
= 15−11
15 = 4
15
b) There are 60 Samsung mobiles, 72 i-phones and 48 mobile phones of HTC brand.
Calculation: There are 180 mobile phones. 1/3 of the mobiles are Samsung, 0.4 =2/5 of
the phones is i-phones and 4/15 of the total phones are HTC.
Hence, the number of Samsung phones = (1/3)*180 = (180/3) = 60.
The number of i-phones = (2/5)*180 = (2*180)/5 = 320/5 = 72.
Therefore, number of HTC mobiles = 180-(60+72) = 180 - 132 =48.
QUESTION 2 [3 marks]
E-commerce sales by businesses in the UK non-financial sector were £511 billion in
2016, up from £503 billion in 2015.
Calculate the percentage change in E-commerce sales between 2015 and 2016.
Answer (type your answer and calculations here): Approximately 1.59045% E-
commerce sales had been increased from the year 2015 to 2016.
Calculation: E-commerce sales in the non-financial sector of UK were £503 billion in
2015. It was £511 billion in the year 2016. Therefore, (£511-£503) = £8 billion sales
had been increased from 2015 to 2016.
Hence, change in E-commerce sales between 2015 to 2016 was (8/503)* 100 =
0.015945*100 = 1.59045%
QUESTION 3 [3 marks]
E-commerce sales in 2017 were made up of £236 billion website sales which is an
increase of 98.76 % from the previous year.
Calculate the E-commerce sales for the year 2016?
GSM LONDON Page 16 of 32

MATI3006- Numeracy1 Spring 2018 Coursework Brief
Answer (type your answer and calculations here): The E-commerce sales for the year
2016 were £118.7362 billion.
Calculation: It was assumed that the E-commerce sales in 2016 were £ x billion. E-
commerce sales in 2017 were made up of £236 billion website sales. Therefore, the
increase in sales was (£ 236- £x) billion. It was mentioned that 98.76% sales had been
increased from the 2016 to 2017.
Therefore, according to the problem, [(236- x)*100/ x] = 98.76
Or, (236- x)*100 = 98.76x
Or, 23600-100x = 98.76x
Or, (100x+98.76x) = 23600
Or, 198x = 23600
Or, x = (23600/198) = 118.7362
Hence, the E-commerce sales for the 2016 were £ 118.7362 billion.
QUESTION.4 [7 marks]
In 2012, a total of £467 billion worth of website sales were generated by UK
businesses. The data gathered was then used to construct the pie chart:
Using the pie chart, please answer the following questions:
GSM LONDON Page 17 of 32
Wholesale
31%
Information &
ommunication
16%
Retail
%
Transport
10%
Manufacturing
6%
Other
23%
Website sales by industry sector, 2012

MATI3006- Numeracy1 Spring 2018 Coursework Brief
a) Which industry contributed the third highest in website sales?
b) Which industry contributed the least in 2012?
c) What percentage does Retail represent in website sales?
d) What much was generated by manufacturing in 2012?
e) How much more was generated by retail than manufacturing?
Answer (type your answer and calculations here):a) Information and communication
contributed the third highest (16%) in website sale.
(b) Manufacturing industry contributed the least (6%) in 2012.
(c) Retail represents 14% in the website sales.
(d) £ 28.02 billion was generated by manufacturing in 2012.
(e) £37.36 billion was more generated by retail than manufacturing.
Calculation: Website sales by industry sector in the year 2012 had been shown through
a pie chart. Whole sales had contributed 31%. Website sale by information and
communication sector was 16%. Other industry had contributed 23%. 6% was generated
through manufacturing. Transport sector had contributed 10%.
Hence, the retail had contributed = [100-(31+23+16+10+6)] % = (100-84) % =16%
a) Therefore, information and communication industry had contributed the third highest
in website sale followed by whole sale sector and other industry sector.
b) Manufacturing industry contributed the least in 2012. They had contributed
(467*6)/100 = £28.02 billion worth of website sale.
(c) Website sale presented by retail was = 100- (31+23+16+10+6) = 14%.
(d) The sales generated by manufacturing in the 2012 was = (467*6)/100 = £28.02
billion worth of website sale.
(e) The sale generated by manufacturing was = £28.02 billion worth of website sale. On
the other hand the sale generated by retail was = (467*14)/100 = £ 65.38 billion.
Hence, the difference between them = (£65.38 - £28.02) = £37.36 billion.
GSM LONDON Page 18 of 32
Paraphrase This Document
Need a fresh take? Get an instant paraphrase of this document with our AI Paraphraser

MATI3006- Numeracy1 Spring 2018 Coursework Brief
QUESTION 5 [5 marks]
Low pay by qualification
1. Data source: Labour Force Survey, ONS.
The chart above shows the proportions of workers who are low paid by qualification
level comparing 2011 with 2016. Using the chart, write a statement outlining at least
three changes,that have taken place.
Answer (type your answer and calculations here): The number of low paid workers by
qualification had increased in 2016 with respect to 2011.
Calculation: From the above diagram, it was seen that below 10% workers had been
paid less according to their qualification i.e degree or equivalent in the year 2011. This
percentage became above 10% in the year 2016. The percentage of low paid workers in
the year 2011 who had completed higher education was just above the 20% while this
percentage was near about 30% for the year 2016. Less than 30% workers who had
completed GCE A level were paid low in 2011. This percentage increased in the year
2016. In 2011, it was seen that about 30% workers were paid less who had GCSE
grades A* - C or equivalent. The above-mentioned proportion had increased in the year
2016. It became more than 40% in 2016. The percentage of other qualification holder
workers who were paid less according to their qualification was 40% in the year 2011
and 50 % in the 2016. It was mentioned that below 50% of workers were paid less in
2011 that had no qualification or their qualification were unknown. It was 70% in the
year 2016.
The total numbers of low-paid highly qualified workers were less in the year 2011 with
respect to 2016.
GSM LONDON Page 19 of 32

MATI3006- Numeracy1 Spring 2018 Coursework Brief
The number of less paid workers with a degree of GCE A level and the number of less
paid workers with a degree of GCSE grade A* to C was almost same in 2011. Similarly,
these numbers were almost same in 2016. It was to be noted that the number of workers
with the mentioned degree was more in 2016 than in 2011.
QUESTION.6 [6 marks]
The chart below lists the E-commerce sales of businesses in the UK non-financial sector
from 2009 to 2016. Calculate the index to show the relative positions over the eight
years.
The base year is2008, sales for 2008 were 334.6, (334.6 = 100).
2009 2010 2011 2012 2013 2014 2015 2016
£ billion 375.1 418.9 494.1 473.6 544.7 513.5 502.8 510.5
Index 12.104 25.194 47.669 41.542 62.791 53.467 50.269 52.570
Answer (type your answer and calculations here and in the chart above): Calculation:
The base year is 2008. Sales for 2008 were 334.6. Sales for 2009 were 375.1. Therefore,
relative index for 2009 with respect to 2008 is (375.1-334.6)*100/334.6 =12.104.
Sales for 2010 were 418.9. Thus, the relative index for 2010 with respect to 2008 is
(418.9-334.6)*100/ 334.6 = 25.194.
Sales for 2011 were 494.1 and sales for the base year were 334.6. Hence, the relative
index for the year 2011 with respect to 2008 is (494.1 -334.6)*100/334.6 =47.669.
Sales for 2012 were 473.6 and sales for 2008 were reported as 334.6. Hence, the
required relative index is (473.6-334.6)*100/334.6 = 41.542
Sales for 2013 were 544.7 and sales for the base year were 334.6. Therefore, the
required relative index is (544.7-334.6)*100/334.6 = 62.791.
It was reported that the sales were 513.5 in 2014. Therefore, the relative index is (513.5-
334.6)*100/334.6 = 53.547
The relative index for the year 2015 with respect to 2008 is (502.8-334.6)*100/334.6 =
50.269 as the sales for 2015 were 502.8 and it were 334.6 for the year 2008.
Sales for the year 2008 were 334.6 and the sales for the year 2016 were 510.5. Hence,
the required relative index is (510.5-334.6)*100/334.6=52.570.
GSM LONDON Page 20 of 32

MATI3006- Numeracy1 Spring 2018 Coursework Brief
Please answer questions 8 – 12 using data provided below:
GSM LONDON Page 21 of 32
Please answer questions 8 – 12 using data provided below:
GSM LONDON Page 21 of 32
Secure Best Marks with AI Grader
Need help grading? Try our AI Grader for instant feedback on your assignments.

MATI3006- Numeracy1 Spring 2018 Coursework Brief
GSM LONDON Page 22 of 32

MATI3006- Numeracy1 Spring 2018 Coursework Brief
QUESTION 8 [2 marks]
What percentage of people living in London, live in Wandsworth?
Answer (type your answer and calculations here): Approximately, 3.76% people living
in London, live in Wandsworth.
Calculation: Total number of people in London is 8173900 and the total number of
people in Wandsworth is 307000. Therefore, the required percentage =
(307000/8173900)*100 = 3.76.
QUESTION 9 [2 marks]
In Havering, how many people are aged 65 and over?
Answer (type your answer and calculations here):Approximately, 42222 people are
aged 65 and over in Havering.
Calculation: Total number of people in Havering is 237200.About 17.8% people of
them are aged 65 and over in Havering. Hence, the required number of people is =
(237200*17.8)/100 =42221.6. The number of people cannot be in fraction. Therefore,
there are 42222 people of age more than or equal to 65.
QUESTION 10 [3 marks]
How many more people are aged between 20 and 64 in the City of London than
Kingston upon Thames?
Answer (type your answer and calculations here):There are 5162488 more people in
city of London than Kingston upon Thames of age between 20 and 64.
Calculation: There are 160100 people in Kingston upon Thames. About 63.4% people
are between 20 to 64 years. Hence, total number of people in Kingston upon Thames of
age between 20 years to 64 years is = (106100*63.4)/100 = 101503.4. The number of
people must be integer. Hence, total people of Kingston upon Thames of age between
20 years to 64 years are 101503. Similarly, the number of people aged 20 years to 64
years can be calculated in the city of London. Total population in the city of London is
= 8173900. Approximately, 64.4% of total population are aged between 20 and 64
years in the city of London. Therefore, total number of people in London in this
particular age group is = (8173900*64.4)/100 = 5263992. Hence, (5263992-101503)
=5162488 more people are aged between 20 and 64 in the city of London than Kingston
upon Thames.
GSM LONDON Page 23 of 32

MATI3006- Numeracy1 Spring 2018 Coursework Brief
QUESTION 11 [4 marks]
If one third of the people live in the City of London, one fifth of the population live in
Inner London and the rest in Outer London.
What is the ratio of City of London to Outer London?
Answer (type your answer and calculations here):The ratio of city of London to Outer
London is 21:2.
Calculation: Total population in England and Wales is 56075900. It is assumed that one
third of the population live in city of London. Then, the number of population in the city
of London is (56075900/3) =18691967.It is also assumed that one fifth of the
population live in inner London. Hence, the number of population in inner London is =
(56075900/5) = 11215180. Hence, the population in outer London is = (18691967 -
11215180) = 7476787.
Hence, the proportion of City of London to Outer London = (18691967/7476787) =
21/2. Therefore, the required ratio is 21:2.
QUESTION 12 [6 marks]
Taking into account individual aged 5-19, in Barnet, Islington, Tower Hamlets, City of
London, Hackney, Sutton, and Greenwich, please calculate the following:
a) Mean
b) Median
c) Range
Answer (type your answer and calculations here):(a) Mean=239298.5, (b)
Median=43197, (c) Range = 1384612.
Calculation: Total population of age 5-19 in Barnet is = (356400*18)/100 = 64152.
Total population of age 5-19 in Islington is = (206100*14.3)/100 =29472. There are
(254100*17)/100 = 43197 people of age group 5 to 19 years in Tower Hamlets. The
number of people in this specified group in the City of London is = (8173900*17.3)/100
= 1414085. The number of people in this specified group in Hackney is =
(246300*17.3)/100 = 42610. The number of people of age group 5 to 19 years in Sutton
is = (190100*18)/100 = 34218. There are (254600*18.6)/100 = 47356 people of age
group 5 to 19 years in Greenwich.
(a) Hence, the required mean is =
(64152+29472+43197+1414085+42610+34218+47356)/7 = 239298.5
(b) The values are arranged in ascending order. Then, the values are 29472, 34218,
42610,43197,47356,64152 and 1414085. Seven cities of England and Wales are taken
into consideration. Therefore, median is the (7+1)/2 = 4th value of the arrangement.
Hence, the required median is 43197.
(c) In Islington, population of this specified group is less among the all mentioned
cities. It is 29472. In the City of London, the population of this particular group is more
GSM LONDON Page 24 of 32
Paraphrase This Document
Need a fresh take? Get an instant paraphrase of this document with our AI Paraphraser

MATI3006- Numeracy1 Spring 2018 Coursework Brief
than all specified cities. It is 1414085. Therefore, the required range is = (1414085 -
29472) =1384612.
QUESTION 7 [6 marks]
Household work status and the income distribution
Poorest
20% 2nd Middle
20% 4th Richest
20%
0%
20%
40%
60%
80%
100%
120%
Pensioner households
Workless households
At least one adult in work, but
not all
All adults in work - one or
more part-time
All adults in work - all full-time
Data source: Households Below Average Income, DWP. 2016
Using the data presented in the bar chart above, answer the following questions:
a) What percentage of all of the adults in the lowest percentile, are in work full time?
Answer: Approximately 14% of all of the adults in the lowest percentile are in work full
time.
b) What percentage of people in the richest 20% has at least one adult that is in work?
Answer: About 20% of people in the richest 20% has at least one adult that is in work.
c) What percentage of people in the middle have pensioner households?
Answer: About 10% of people in the middle have pensioner households.
GSM LONDON Page 25 of 32

MATI3006- Numeracy1 Spring 2018 Coursework Brief
QUESTION.13. [10 marks]
Think about your modules and amount of time you spend studying per week, create a
table and answer following questions
Module/
Weeks
Week
1
Week
2
Week
3
Week
4
Week
5
Week
6
Week
7
Week
8
Numeracy1 7 6.5 6 5 4.6 4.3 4.2 4
EAP1 5 4.8 4.5 4.3 4.2 4.1 3.5 3
EBWO3001 4 3.8 3.6 3.3 3.1 2.9 2.7 2.5
ICSK3005 2 1.8 1.4 1.2 1 0.5 0.4 0.2
18 16.9 15.5 13.8 12.9 11.8 10.8 9.7
a) Create a bar chart based on your entries above.
b) What does your data tell you, comment on the pattern (if any)?
c) What is the average time you spend studying throughout 8 weeks for all of your
modules? Show your calculations.
d) Create a table to show individually the total number of hours spent studying for
each one of the four modules over the 8 weeks .
Answer (type your answer and calculations here): (a) Bar charts are plotted
based on the entries.
GSM LONDON Page 26 of 32

MATI3006- Numeracy1 Spring 2018 Coursework Brief
week1 week2 week3 week 4 week 5 week6 week7 week 8
0
1
2
3
4
5
6
7
8
Numeracy 1
EAP1
EBWO3001
ICSK3005
Figure 1: Bar diagram for different modules on different weeks
Source: Created by Author
Numeracy 1 EAP1 EBWO3001 ICSK3005
41.6
33.4
25.9
8.5
Total number of hours spent for
different modules
Module
Total number of hours
Figure 2: Bar diagram for total number of hours spent for different modules.
Source: Created by Author.
GSM LONDON Page 27 of 32
Secure Best Marks with AI Grader
Need help grading? Try our AI Grader for instant feedback on your assignments.

MATI3006- Numeracy1 Spring 2018 Coursework Brief
week1 week2 week3 week 4 week 5 week6 week7 week 8
20 18.7 16.9 15 13.9 12.3 11.2 9.9
Bar chart of Total hours spent in
different weeks
Number of weeks
Nuber of Hours
Figure 3: Bar chart of total hours spent in different weeks.
Source: Created by Author
(b) It is seen from figures that more times are spent in first week.
Comparatively, less time is provided in 2nd to 8th week. Least time is taken in
8th week. It is also seen that more time is provided in Numeracy 1. Less time is
taken in EAP 1 module. Less time is taken in EBWO3001 module than the
above-mentioned two modules. Least time is provided to ICSK3005 module.
(c) Total time spent for Numeracy1 module is 41.6 hours. Total 33.4 hours are
spent in EAP1. It is also to be noted that about 25.9 hours are spent in
EBWO3001. It is noted that 8.5 hours are provided for ICSK3005 module.
References:
Holland, C.K., Mast, T.D., Haworth, K.J. and Abruzzo, T.A., 2017. Biomedical
research at the image-guided ultrasound therapeutics laboratories. The Journal of the
Acoustical Society of America, 141(5), pp.3681-3681.
GSM LONDON Page 28 of 32
Modules/
Week
week
1
week
2
week
3
week
4
week
5
week
6
week
7
week
8
Tota
l
Numeracy 1 7 6.5 6 5 4.6 4.3 4.2 4 41.6
EAP1 5 4.8 4.5 4.3 4.2 4.1 3.5 3 33.4
EBWO3001 4 3.8 3.6 3.3 3.1 2.9 2.7 2.5 25.9
ICSK3005 2 1.8 1.4 1.2 1 0.5 0.4 0.2 8.5
Total 18 16.9 15.5 13.8 12.9 11.8 10.8 9.7
109.
4

MATI3006- Numeracy1 Spring 2018 Coursework Brief
Mendenhall, W.M. and Sincich, T.L., 2016. Statistics for Engineering and the Sciences.
Chapman and Hall/CRC.
Ung, T.S., Kiong, P.L.N., Manaf, B.B., Hamdan, A.B. and Khium, C.C., 2017, April.
Cognitive analysis as a way to understand students’ problem-solving process in
BODMAS rule. In AIP Conference Proceedings (Vol. 1830, No. 1, p. 050002). AIP
Publishing.
Wheeler, A. and Champion, J., 2016. Stretching Probability Explorations with
Geoboards. Mathematics Teaching in the Middle School, 21(6), pp.332-337.
The End
GSM LONDON Page 29 of 32

MATI3006- Numeracy1 Spring 2018 Coursework Brief
Marking Criteria
Generic CriteriaforAssessmentatLevel3
Assessment
categories
Knowledge&
Understandingof
Subject
Inadequate
understanding of
and major
gapsin
knowledge.
Significant
inaccuracies.
Limited understanding
of and large gapsin
knowledge evident.
Someinaccuracies.
Thresholdlevel.
Basic and
broadlyaccurate
knowledgeand
understanding of
thematerial.Some
elementsmissing
andflawsevident.
Satisfactory,routine
knowledgeand
understanding of
thematerial,main
concepts
Someflawsmaybe
evident.
Good,consistent
knowledgeand
understanding
ofthe
material,main
conceptsatthislev
el.
Excellentknowled
ge
andunderstanding
of
themainconceptsa
tthislevel.
Excepti
onal
knowle
dgeand
underst
anding
of
Material and
conceptsatthisl
evel.
Cognitive/
IntellectualSkills
(e.g.analysisand
synthesis; logic and
argument;
analytical
reflection;
organisationand
communication of
ideasand evidence)
Inadequate
views based on
personal
opinion.
Complete lack
of supporting
evidence.
Inadequate or
complete lack
of conclusions.
Limited logic and
analysis, and lack of
consistent argument.
Points generally
descriptive and at times
incoherent.
Conclusionslack
validity.
Thresholdlevel.
Basicawareness
of issues. Some logical
arguments evident. Lacks
coherence in places.
Some inconsistency in
evidencetosupport
views. Some broadly
valid conclusions
included.
Issuesidentified
satisfactorily within
givenareas.
Demonstration of the
abilitytouse
evidencetosupport a
coherent argument.
Some generally valid
conclusions included.
Good analytical
ability.
Argumentsgener
ally
logical, largely
balanced,
coherently
expressedand
supported with
evidence.
Soundconclusion
s included.
Excellent
logicalanalysis
throughout.
Persuasivepoints
madewithingiven
areas of the
work..
Argumentswell-
balancedand
logicallydevelope
d and supported
witharangeof
evidence.
Strongconclusion
s included.
Exceptionall
y
logicalanalys
is
throughout.
Persuasive
argumentsi
ncluded
throughout
thework
supported
by
appropriat
ely selected
evidence.
Useof
Research-
informed
Literature
(including
referencing,
appropriate
academic
conventionsand
academichonesty)
Inadequate
evidenceof any
background
reading. Views
are
inadequately
supported.
Inadequate /
no use of
academic
conventions at
this level.
Evidenceoflimited
readingaround the topic
of the work.
Sources inaccurately
utilised.
Limited use of academic
conventions at this level.
Thresholdlevel.
Someevidenceof
reading around the
topic of the work.
Basicacademic
conventions
followed at this
level,butwith errors.
Satisfactory range of
literatureused mainly
descriptively.
Academicskills
generally sound at
this level.
Good range of
relevant literature
generally used
critically to
inform argument.
Good
useofacademic
conventions at
this level.
Excellent range of
relevant literature
used critically to
inform argument.
Consistentlyaccur
ate useofacademic
conventions at
this level.
Exception
alrangeof
relevant
literatureused
critically to
informargume
nt.
Consistently
accurateands
kilful
useofacademi
c conventions
at this level.
GSM LONDON Page 30 of 32
1 out of 31
Related Documents
![[object Object]](/_next/image/?url=%2F_next%2Fstatic%2Fmedia%2Flogo.6d15ce61.png&w=640&q=75)
Your All-in-One AI-Powered Toolkit for Academic Success.
+13062052269
info@desklib.com
Available 24*7 on WhatsApp / Email
Unlock your academic potential
© 2024 | Zucol Services PVT LTD | All rights reserved.