Project Management Methodologies: Latino Engineering Improvement Plan
VerifiedAdded on 2020/03/16
|11
|3530
|39
Report
AI Summary
This report proposes a continuous improvement framework for Latino Engineering Company, which has been facing challenges related to customer dissatisfaction due to poor product design, defective products, and inadequate customer service. The report begins with an introduction to the company's background, the challenges it faces, and the need for a continuous improvement strategy. It proposes a framework based on the Kaizen philosophy, emphasizing organization-wide understanding and internalization of continuous improvement. The report utilizes the POTI model (Processes, Organization, Technology, Information) to analyze the company's current state and identify areas for improvement. It then details the implementation of seven basic quality control tools (7QC), including cause and effect diagrams, flowcharts, check sheets, Pareto diagrams, histograms, control charts, and scatter diagrams, to analyze problems, determine root causes, and monitor progress. The framework aims to improve business processes, organizational structure, technology utilization, and information management to enhance product quality, customer service, and overall business performance. The goal is to restore Latino Engineering to its former success by implementing lasting improvements.
Project management methodologies
Name
Date
Name
Date
Paraphrase This Document
Need a fresh take? Get an instant paraphrase of this document with our AI Paraphraser
Table of Contents
Introduction..........................................................................................................................................3
CIP Strategy for Latino Engineering....................................................................................................3
Processes..........................................................................................................................................4
Organization.....................................................................................................................................4
Technology.......................................................................................................................................4
Information......................................................................................................................................5
Seven Basic Quality Control Tools.......................................................................................................5
Cause and Effect Diagram...............................................................................................................5
Flow charts.......................................................................................................................................6
Check-sheets....................................................................................................................................6
Pareto diagrams................................................................................................................................6
Histograms.......................................................................................................................................7
Control Charts..................................................................................................................................7
Scatter Diagrams..............................................................................................................................7
Conclusion............................................................................................................................................8
References............................................................................................................................................9
Appendix I: Diagrammatic representation of Latino Engineering CIP..............................................11
Introduction
Latino Engineering Company has for the last thirty years been a trusted designer and manufacturer
of various engineering equipments for diverse industries, including oil and gas, infrastructure, and
construction firms. This gave the company a loyal customer base and led to impressive business
performance in terns of sales revenues. A year ago, the founder, Mr Dominic Latino decided to sell
the entire company to the new owners rather than sell a portion of the company, fearing that tis
would dilute his control of the company and especially his ability to make decisions fast. The new
owners took over the company and agreed to retain the name and the employees, although some
managers left in pursuit of greener pastures. In the last twelve months, the company has faced the
challenge of increasing customer dissatisfaction, with complaints ranging from defective
engineering products, poor design and development follow ups with clients, a non responsive
customer service, Latino Engineering taking too long to solve customer issues, and cases of the
wrong equipment being packed and sent to customers. The complaints basically point to two main
issues; poor product design and production, and poor customer service. The departure of some
managers and Dominic also imply that the control levels at the company changed for the worse,
given the mounting problems touching the core of the company’s reputation. This report, therefore,
is a proposal for a framework that will ensure the stated problems are solved through a process of
continuous improvement. The report first discusses the development of a new vision for the
company and then uses quality control tools to initiate the process of continuous improvement. To
ensure permanent and lasting improvements and move the company from lean improvements to
lasting improvements, as argued by Mishra and Gupta (2010) and Fine, Hansen and Roggenhofer
(n.d). To ensure lasting changes and restoration of Latino Engineering to its former glory, this report
proposes that the continuous improvement framework of Kaizen that will not only enhance quality
improvement, but also help create an organization-wide understanding and internalization of
continuous improvement (CI) as it makes CI everyone’s duty, according to Kaiser (2015) and Imai
(2012).
CIP Strategy for Latino Engineering
The problems at Latino Engineering are complex and significant; the continued growth and survival
of the company depend on them being solved. To solve the problems, the root causes must first be
established and steps taken to continuously make improvements (Demers 2008). A root cause
analysis will be undertaken in the context of the key aspects of the organization before the problems
can be incrementally reduced (Rudy, 2014). To determine the root causes of the problems, the POTI
model will be employed to develop a blue print and vision of what Latino Engineering should be by
⊘ This is a preview!⊘
Do you want full access?
Subscribe today to unlock all pages.
Trusted by 1+ million students worldwide
evaluation the processes at the organization, the organization itself, its attendant technologies, and
information. Using the POTI model, the high level scope of what will be changed at Latino
Engineering will be clearly defined and understood once the tools for CI are implemented.
Processes
Business processes have a huge effect on the performance of an organization; changing the
businesses processes will equally have a huge impact on the organizational performance of firms,
according to Š krinjar, Š temberger & Hernaus (2007). The processes at Latino Engineering will be
evaluated and old unwieldy processes replaced with new ones. The operating business models have
a direct effect on organizational output and performance and changing these operational models will
create a new vision for the organization (Sherman 2009). The operating business models to be
examined include the levels of performance and output, the way tasks are undertaken where old
ways will be phased out and new ones introduced while existing ways of working will also be
changed. The vision is that of a Latino Engineering where employee output and performance
increases and new ways of working that focus on the customer and on quality by harnessing
technology are used
Organization
According to Rick (2014), organizations doesn't really change, it is people that do change and if
people do not change, then the organization will not change. For every business, change is the only
constant; however, change must be managed well if the organization is to get it right and move
towards a desired direction. The project will require some people changes and includes
organizational change to personnel and the number of employees , along with their skills and
training needs. The skill set and new skill requirements of employees will be examined, along with
the existing culture and what cultural changes are needed. The training needs f the employees will
also be examined. The envisaged situation is that of a company with highly skilled and productive
employees that are well versed with the organizational strategy that promotes quality and
performance. The culture at the organization also needs to shift towards focus on the customer and
quality delivery (for products and service).
Technology
Technology is today a crucial area for any business, responsible fro driving innovation and
sustaining business growth, according to Holmlund (2014), with IT and computers taking the lead.
The company wide technology infrastructure as presently set will be examined and changes made
where the existing systems fall short. The existing systems and tools will be evaluated and
improvements made. The envisaged blue print is that of Latino Engineering whose operations are
Paraphrase This Document
Need a fresh take? Get an instant paraphrase of this document with our AI Paraphraser
aided by technology from customer service to product design and testing to ensure that products
undergo go the strictest testing and are designed using the latest tools to reduce/ remove defects and
errors and inspire innovation of new better products for the customers. Equipment and tools
considered outdated or unsuitable for the needs of the company will be gotten rid of and replaced
with new ones suitable for the needs of the company and employees.
Information
As technology advances, data has become crucial for giving companies a competitive advantage
through better planning and decision making, according to Shelushkov (2017), (Janoschek 2017).
the information perspective refers to intangible data/ big data and the required information for the
new and transformed Latino Engineering. At the onset, such changes are a challenge to establish;
however, through a process of continuous improvement, it will become apparent the kind of
information required by the organization to better serve the needs of clients and restore quality
products. Information serves a range of purposes including decision making, planning, forecasting,
and customer service. The envisioned state is that of a company with seamless information flows
across all levels and with clients so as to help the company make the best decisions. For instance,
customer complaints information, working with computer technology systems will help understand
the nature of customer complaints and anticipate them; Latino Engineering should reach a level
where it undertakes predictive analytics to tackle problems before they occur.
Seven Basic Quality Control Tools
Based on the reported problems at Latino Engineering, quality control is critical for the company to
restore its lost glory and move on to greater heights. Asfter using the POTI foundation to develop a
vision, the Seven Basic Tools for Quality Control (7QC) will be employed to generate information
and data on the company and help in determining the areas where changes are needed. The 7QC
tools are basic easy to use tools made up of the cause and effect diagram, flow charts, check sheets,
Pareto diagrams, Histograms, Control Charts and Scatter diagrams (Ishikawa 2012). These are
discussed in details in the following section;
Cause and Effect Diagram
This is an important tool that will be used t identify the root cause to the identified problems; the
probable contributing factors make up the causes while the problems make up the effect(s). for
instance, defective engineering products could be because of poor design, lack of collaboration
among the design and development team, and inadequate testing to reveal these problems before the
goods are manufactured. Every cause can be examined further to determine the cause of that cause;
this will be done until the root cause is reached so the the cause effect diagram has many branches
signifying a deeper understanding of the problem (Stackpole 2017)
Flow charts
These will be used to help in establishing the relationships between the steps in a process; it shows
the stepwise flow of operations in the organization that is followed until a solution is obtained, such
as a finished product or a satisfied customer (Mades 2014). The flow charts will be useful for
documenting complex processes and activities, such as the design and development process for an
engineering product. It will be useful for visualizing the activities being undertaken and what is
being processed to enable a better understanding of the entire process. This information will be used
to refine the processes of design and development and customer service to achieve the best
outcomes.
Check-sheets
These will be used to ensure that there is consistent following of a series of steps, for example
during design and development or when handling customer complaints and issues. One reason why
variation occur es during production is because the requisite series of steps are not rigorously
followed, according to Hall and Johnson (2009). The check sheets are also referred to as tally sheets
and will be used to organize data around a problem to do with quality, such as defective engineering
products. Using these tallies over a specific period, the company will know the number of
equipment that are defective and work backwards towards establishing the cause of the problem and
then developing a suitable solution.
Pareto diagrams
This is a chart with both bars and a line used for representing individual values using bars, in a
descending order and the line used to represent the cumulative totals. The Pareto chart graphically
displays events, for example, the defect types or the causes of defects in such a way that the
problems are ranked based on their frequency of occurrence. This arrangement gives priority to the
most pressing problems that should be given immediate attention because they contribute to most
of the problems. According to Koch and Moreno (2011), the Pareto diagram works on the 80/20
principle where 80% of the problems are cause by 20% of th vital causes and 20% of the problems
are due to 80% of the trivial causes. In this way, resources will be allocated selectively to those
causes that will result in significant changes in the problems
⊘ This is a preview!⊘
Do you want full access?
Subscribe today to unlock all pages.
Trusted by 1+ million students worldwide
Histograms
This is also a vertical chart with bars that is used to show the frequency of distribution of factors; it
shows the distribution shape of events. The central tendency of events as well as the dispersion will
be shown by the Histogram and will be used for comparing the distribution to the requirements.
Histograms will be valuable in troubleshooting the causes of the observed problems to show
important differences, for example, on how customer issues are handled between different
employees/ customer service agents. They will also be used to compare different processes with a
view to establishing the process that has the least defects and consumes the least time
Control Charts
This toll will be employed to determine the predictability and stability of processes; the control
chart has a center line which is the planned value in a process. Usually, the processes upper and
lower limits are - or + 3 of the standard deviation form the mean, although depending upon
circumstances. The upper and lower limits define the acceptable quality limits, and these will
especially be useful for setting the quality parameters for engineering products. When measures will
tend towards either of the limits, measures will be taken to get it back to the center line, according
to Misra (2008).
Scatter Diagrams
This is a diagram with an X and Y matrix used to plot the relationship between two different
variables to determine how one of the variables (the independent variable) causes a change in the
other variable (the dependent variable). For example, the scatter diagram can be used to measure the
number of tests done on engineering equipment and the number of errors recorded/ noted. The
relationship between the two when plotted in a graph will show their relationship and an equation
can be derived to predict future outcomes of the dependent variable for every change in the
independent variable (Stackpole 2017).
The above discussed 7 QC tools will be useful in identifying causes or problems, knowing the
relationships between cause and effect, and determining what causes to give effects as well as
monitoring how effective measures put in place are working to reduce problems. Further, they will
be very useful in determining what actions to take to improve quality and eliminated the stated (and
other problems that may exist). These tools must be used repeatedly to achieve CI for Latino
Engineering Company. This will be done in the context of the Kaizen principle of continuous
improvement. According to Medinilla (2014), Kaizen is a principle with its origins in Japan that
means change for the better and is a framework for achieving sustained and continuous
improvement. Effective change usually occurs in a sustainable way through small and subtle
Paraphrase This Document
Need a fresh take? Get an instant paraphrase of this document with our AI Paraphraser
improvements that are continuous. Effective change must occur in a wholesome way, from how
employees view their roles, to processes, and management involvement in the change process. A
single major change does not make everything perfect, smaller and incremental changes in all
aspects result in significant and company wide changes for the long term. By repeatedly making
small improvements in all areas, new ways of doing things are discovered while the concept
becomes part of the culture of the organization, according to ‘Mind Tool’ (2017). continuous
improvement through repeated application of the 7 QC tools will ensure that small incremental
changes are made that are long lasting and ensure the company returns to its pre-sale glory and get
even better. Due to the short duration of the project, the agile scum method will be employed in
managing the project; it entails small incremental tasks that have a fixed time frame and enables
change to start being achieved at the earliest stage. It is also a method that enables tasks to be
completed fast and with minimum cost implications. The process to be followed in implementing
this CIP (Continuous Improvement Plan) at Latino Engineering to solve the identified problems and
possibly identify new problems is diagrammatically shown in Appendix I
Conclusion
Barely 12 months after the new ownership of Latino Engineering, the company is already
experiencing challenges with customers complaining about defective engineering products, poor
design and development follow ups with clients, a non responsive customer service, the company
taking too long to solve customer issues, and cases of the wrong equipment being packed and sent
to customers. The problems show organizational, process, and cultural problems given that some
former managers left the company. In its 30 year existence since founding, the company has built a
reputation for quality and reliability. As such, the best solution is a CIP rather than a major project
to ensure improvement; this will start with a POTI analysis to help develop a new vision and he use
of the 7 QC tools for examining the issues and monitoring them, as well as in setting priorities. The
CIP will be based on the Kaizen principle of repeated, small but sustainable increments in
improvements. Because of the short time period, the scrum model of project management will be
used as it will enable rapid incremental results to be achieved in the given short period, at a
comparatively lower cost compared to traditional methods of managing projects
References
Demers, C. (2008). Organizational change theories: a synthesis. Los Angeles, Calif, SAGE
Publications.
Fine, D., Hansen, M. and Roggenhofer, S. (n.d.). From lean to lasting: Making operational
improvements stick. [online] McKinsey & Company. Available at:
https://www.mckinsey.com/business-functions/operations/our-insights/from-lean-to-lasting-making-
operational-improvements-stick [Accessed 5 Oct. 2017].
Hall, J. and Johnson, E. (2009). When Should a Process Be Art, Not Science?. [online] Harvard
Business Review. Available at: https://hbr.org/2009/03/when-should-a-process-be-art-not-science
[Accessed 5 Oct. 2017].
Imai, M. (2012). Gemba kaizen: a commonsense approach to a continuous improvement strategy.
New York, McGraw Hill. http://www.myilibrary.com?id=366251.
Ishikawa, K. (2012). Introduction to quality control. Berlin, Springer.
Janoschek, N. (2017). Data-Driven Decision-Making: 14 Recommendations on how to benefit.
[online] BI Survey. Available at: https://bi-survey.com/data-driven-decision-making-business
[Accessed 5 Oct. 2017].
Kaiser, A. (n.d.). Workshop in a Box: Communication Skills for IT Professionals. Packt Publishing.
Koch, R., & Moreno, C. (2011). The 80/20 principle: the secret of achieving more with less. Palo
Alto, CA, SmarterComics.
Medinilla, A. (2014). Agile Kaizen: Managing Continuous Improvement Far Beyond
Retrospectives. New York, Springer
MISRA, K. B. (2008). Handbook of Performability Engineering. London, Springer-Verlag London
Limited. http://dx.doi.org/10.1007/978-1-84800-131-2.
‘Mind Tools’. (2017). Kaizen Gaining the Full Benefits of Continuous Improvement. [online] Mind
Tools. Available at: https://www.mindtools.com/pages/article/newSTR_97.htm
Rick, T. (2014). Organizations don't change. People do - or they don't. [online] Torben Rick.
Available at: https://www.torbenrick.eu/blog/change-management/organizations-dont-change/
[Accessed 5 Oct. 2017].
Mades, N. (2014). The first of seven (7) basic quality tools. [online] Quality Assurance and Quality
Control in Construction. Available at: https://www.qualityengineersguide.com/flowchart-the-first-7-
basic-quality-control-tools [Accessed 5 Oct. 2017].
Rudy, L. (2014). Solve Management Problems With Root Cause Analysis. [online] Business Envato
Tuts+. Available at: https://business.tutsplus.com/articles/solve-management-problems-with-root-
cause-analysis--cms-21085 [Accessed 5 Oct. 2017].
⊘ This is a preview!⊘
Do you want full access?
Subscribe today to unlock all pages.
Trusted by 1+ million students worldwide
Sherman, P. (2009). Beyond Head Count Reduction: Powering Performance Through Operational
Change. [online] Businessfinancemag.com. Available at: http://businessfinancemag.com/business-
performance-management/beyond-head-count-reduction-powering-performance-through-
operational [Accessed 5 Oct. 2017].
Shelushkov, A. (2017). Gaining Competitive Advantage with Data-Driven Decision Making.
[online] Itransition.com. Available at: https://www.itransition.com/blog/gaining-competitive-
advantage-with-data-driven-decision-making [Accessed 5 Oct. 2017].Š
krinjar, R., Š temberger, M., & Hernaus, T. (2007). The impact of business process orientation on
organizational performance. InSITE 2007.
Stackpole, C. (2017). 7 Basic Quality Planning Tools You Should Know for the PMP Certification
Exam - dummies. [online] Dummies. Available at: http://www.dummies.com/careers/project-
management/pmp-certification/7-basic-quality-planning-tools-you-should-know-for-the-pmp-
certification-exam/ [Accessed 5 Oct. 2017].
Paraphrase This Document
Need a fresh take? Get an instant paraphrase of this document with our AI Paraphraser
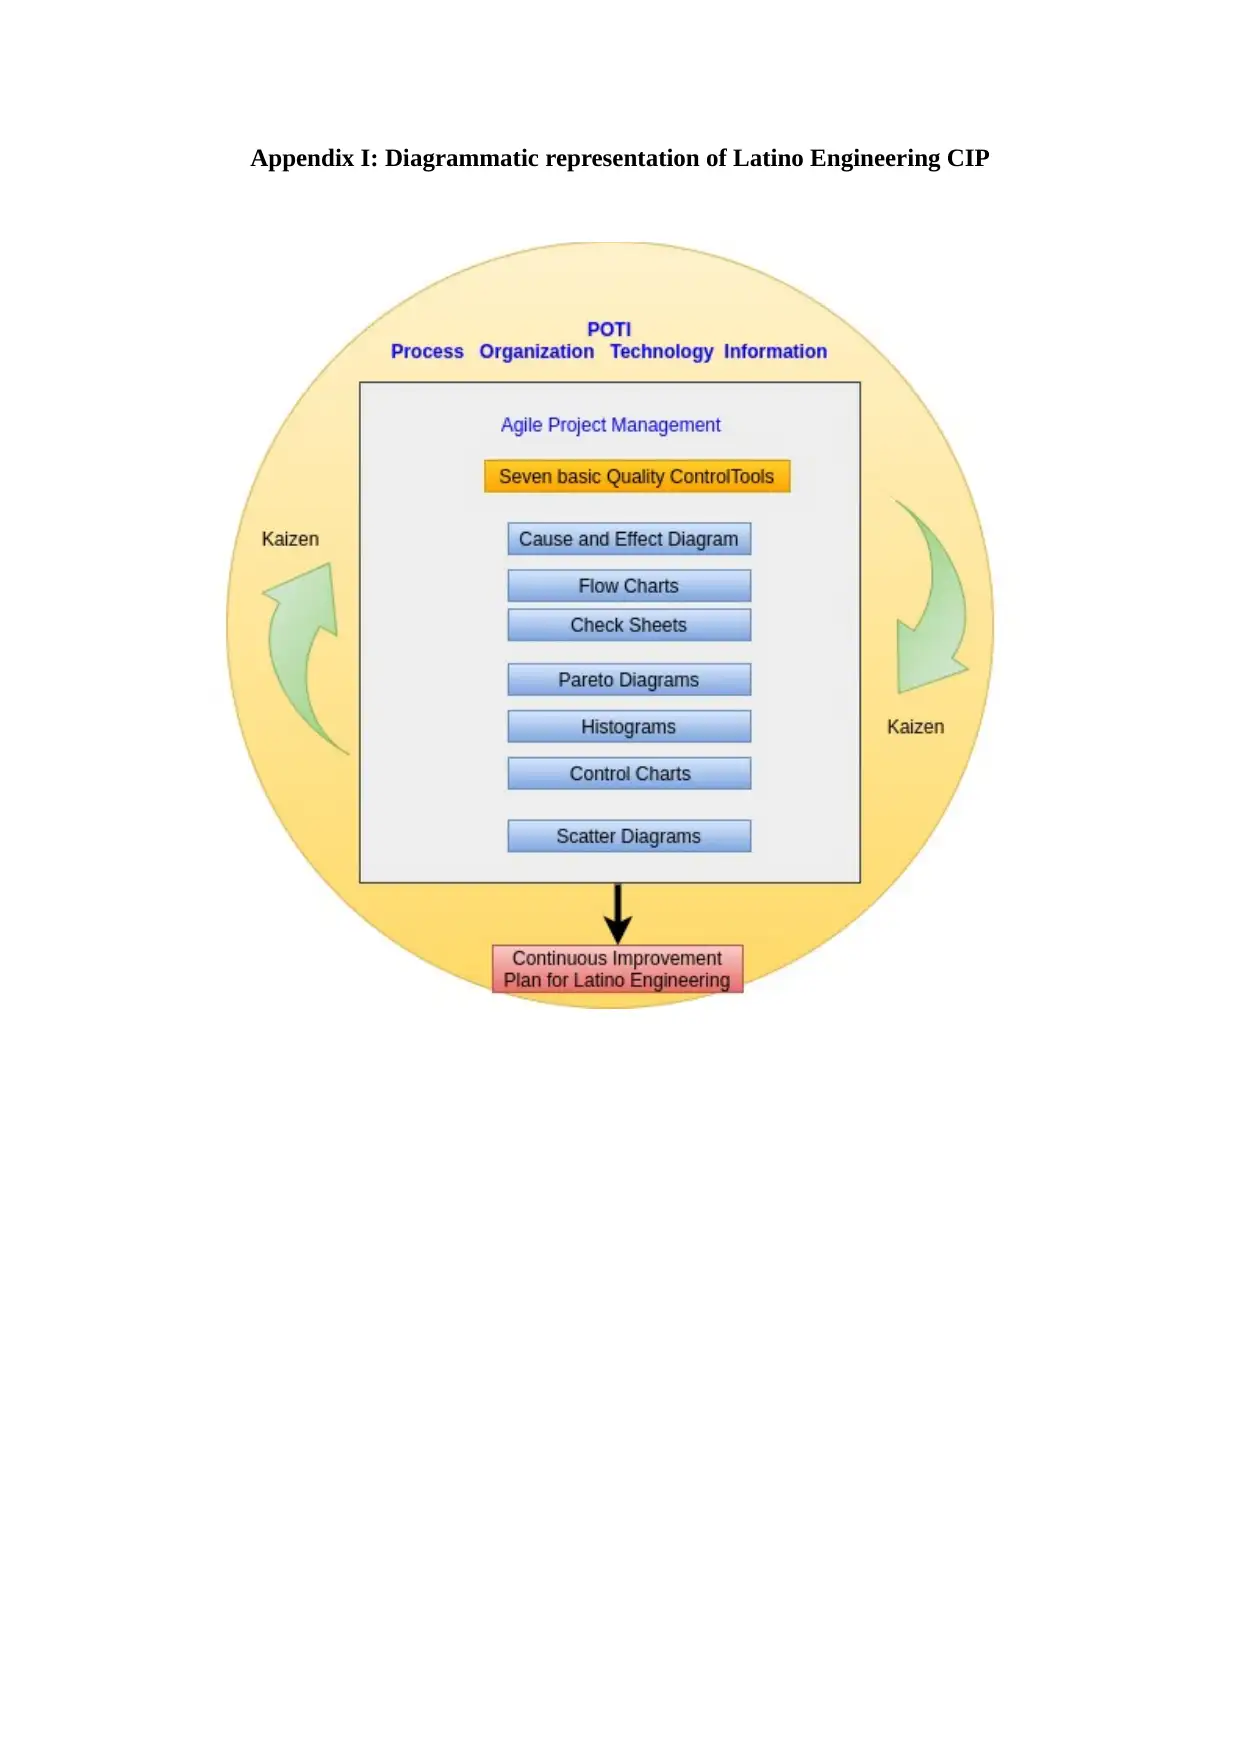
Appendix I: Diagrammatic representation of Latino Engineering CIP
1 out of 11
Related Documents


Your All-in-One AI-Powered Toolkit for Academic Success.
+13062052269
info@desklib.com
Available 24*7 on WhatsApp / Email
![[object Object]](/_next/static/media/star-bottom.7253800d.svg)
Unlock your academic potential
Copyright © 2020–2026 A2Z Services. All Rights Reserved. Developed and managed by ZUCOL.