Comprehensive Statistical Analysis of CPI, RPI, and Earnings Data
VerifiedAdded on 2020/11/23
|16
|2807
|201
Report
AI Summary
This report provides a comprehensive statistical analysis of Consumer Price Index (CPI) and Retail Price Index (RPI) data from the Office of National Statistics (ONS) over a 10-year period. It includes the location of data, production of graphs and tables, and a comparison between CPI and RPI, including the application of CPI for extracting annual inflation and the significance of the rate of inflation. The report also analyzes hourly pay rates, including quartile, median, mean, and standard deviation calculations, and compares earnings between London and Manchester. Furthermore, it utilizes paired t-tests to assess statistical differences and calculates confidence intervals. The analysis incorporates various statistical methods and presents findings through graphs and tables. The report concludes with a summary of the key findings and references used throughout the analysis.

STATISTICS MANAGEMENT
Paraphrase This Document
Need a fresh take? Get an instant paraphrase of this document with our AI Paraphraser
TABLE OF CONTENTS
INTRODUCTION...........................................................................................................................1
ACTIVITY 1....................................................................................................................................1
A. Locate data on basis of ONS related to 10 years data for CPI and RPI..................................1
B. Produce graph and table for above information......................................................................2
C. Retail Price Index vs Consumer price Index...........................................................................3
D. Application of CPI for extracting annual inflation.................................................................4
E. Rate of inflation with its significance......................................................................................4
ACTIVITY 2....................................................................................................................................5
A. Hourly Pay rates......................................................................................................................5
1. Quartile and Median hourly earning with ogive......................................................................5
2. Mean and standard deviation of hourly earning......................................................................7
B. Comparison among earnings of London and Manchester.......................................................8
ACTIVITY 3....................................................................................................................................9
A. Paired t test with 5% significance level..................................................................................9
B. Normal conditions of paired t test...........................................................................................9
C. 99% confidence interval with objective of mean reduction..................................................10
ACTIVITY 4..................................................................................................................................11
A. Line or bar charts with alteration in RPI and CPI for 10 years till 2017..............................11
B. Ogive chart of cumulative% of staff versus hourly earnings................................................12
CONCLUSION..............................................................................................................................12
REFERENCES..............................................................................................................................14
INTRODUCTION
Statistics is known as data science as it is set of numerous mathematical equation which
are used for analysing different things in quantitative format. It helps in giving appropriate
information about present happenings. In the present scenario, it is very important because
information on basis of world is identified with context of statistics only. On a very important
note, it is used through management with objective of giving quality assurance, operations,
financial analysis and production in multiple business areas. There is development of confidence
in manager to deal with uncertainty and for effective decision making to give huge reliance of
staff and stable leadership. The present report will provide brief analysis on basis of Consumer
price Index and retail price Index from Office of National Statistics website as it will show
variations among these indices in clear perspective. This report will directly analysis and
evaluate different raw business data on basis of multiple statistic method. Furthermore, It will
represent statistical method on context of business planning and its finding and outcome will be
shown in presentable format such as graph and tables will be drawn.
ACTIVITY 1
A. Locate data on basis of ONS related to 10 years data for CPI and RPI
Retail Price index: This is measure of inflation which is always published in monthly
basis through Office of National Statistics. It tracks alteration in cost of fixed basket of goods
over fixed duration. The services or goods which are used such as food, household goods,
heating, petrols and bus fares (Song and Wang, 2018). The weighing of goods has been where
items like housing are highly weighted and items such as tobacco are of lower weight.
Consumer price Index: This price indices is majorly used through national statistical
agencies as yearly percentage change in CPI is considered as particular inflation measure. In
simple words, it is measure of alteration in price for collecting goods and services like
transportation, medicine and groceries as appropriate benchmark for gauging inflation cost along
with living. CPI is recorded with objective of observing consumer's purchasing power or to stay
with it.
1
⊘ This is a preview!⊘
Do you want full access?
Subscribe today to unlock all pages.
Trusted by 1+ million students worldwide
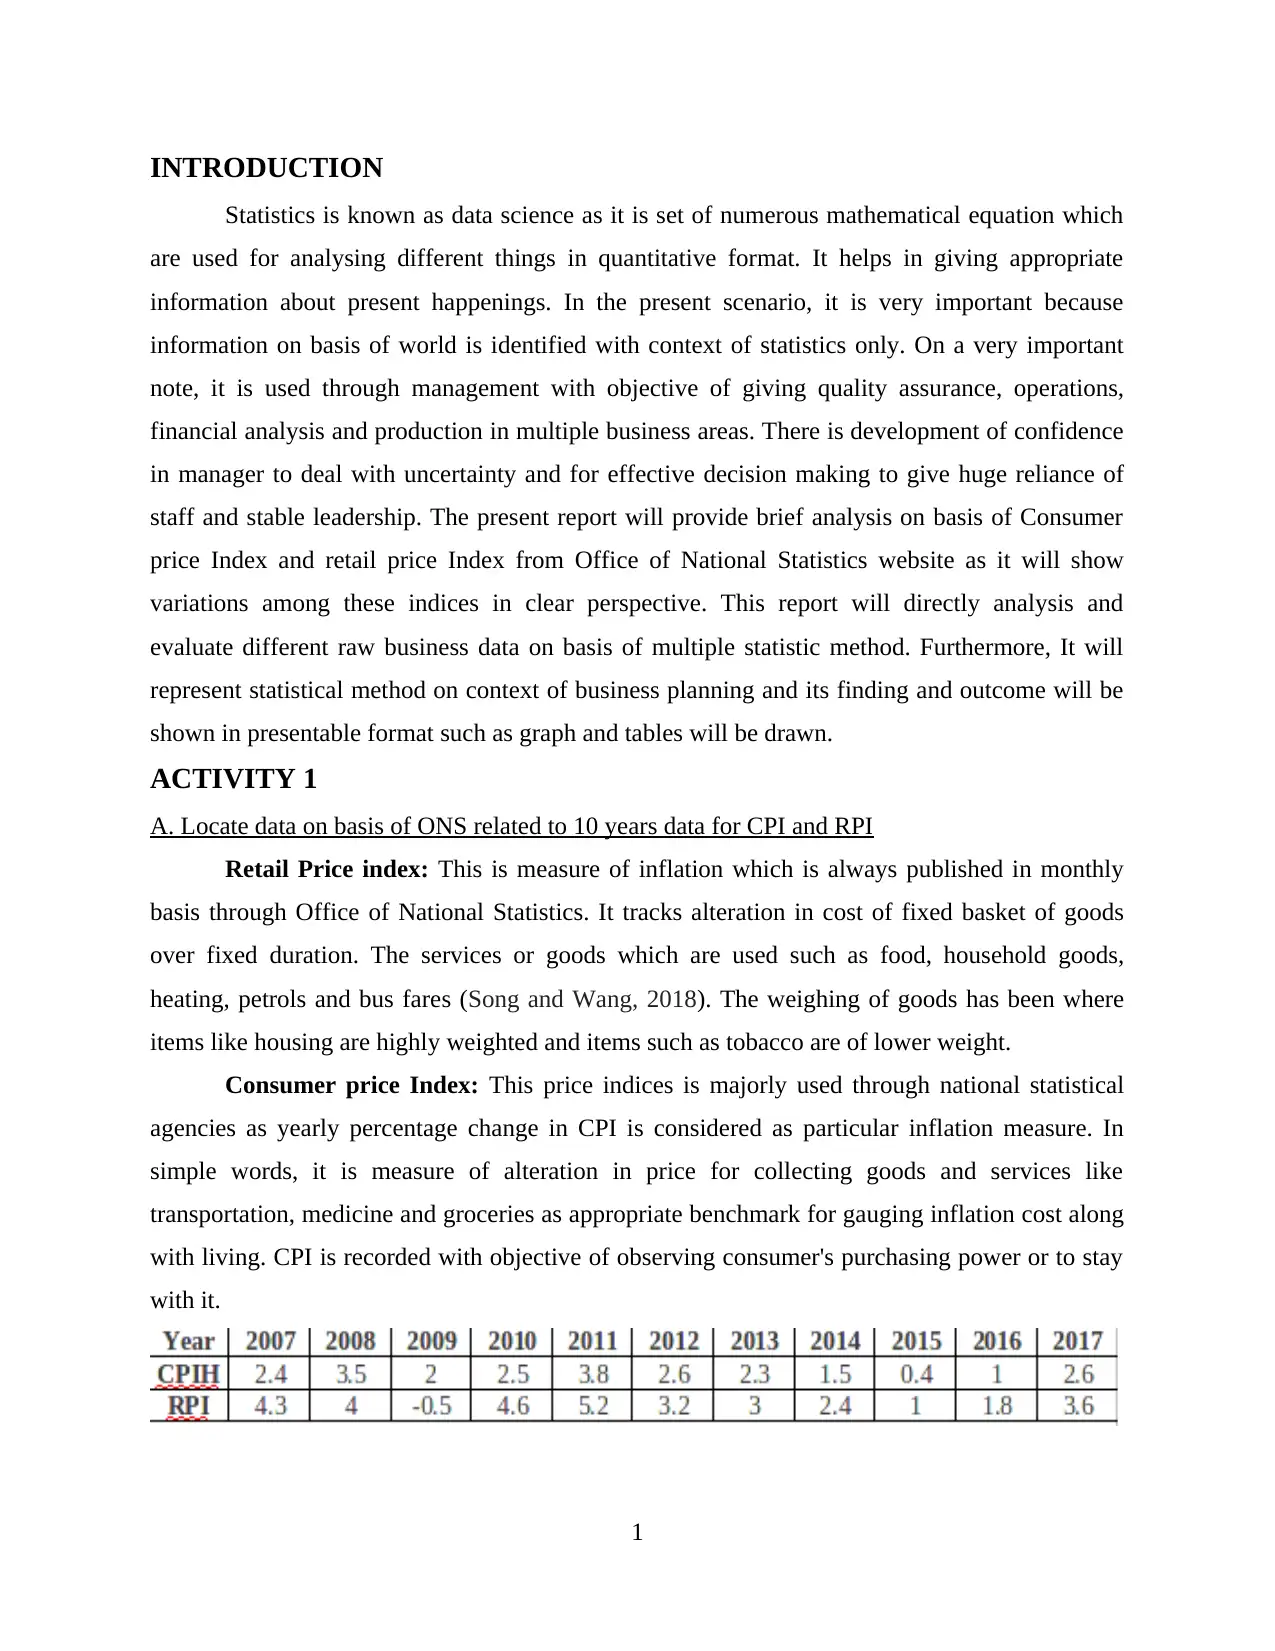
Interpretation: There is representation of retail price and consumer price indices from
2007 to 2017 from ONS website. It could be observed that there are numerous fluctuations in
this particular data base as it shows purchasing power of consumer along with trade of United
Kingdom. The CPI's highest rate is 3.8 where its minimum is 0.4. However, RPI's minimum is -
0.5 and maximum is 5.2 in past 10 years from 2007 to year 2017.
B. Produce graph and table for above information
Illustration 1: Percentage change in RPI (bar chart)
Illustration 2: Percentage change in CPI (bar chart)
2
Paraphrase This Document
Need a fresh take? Get an instant paraphrase of this document with our AI Paraphraser
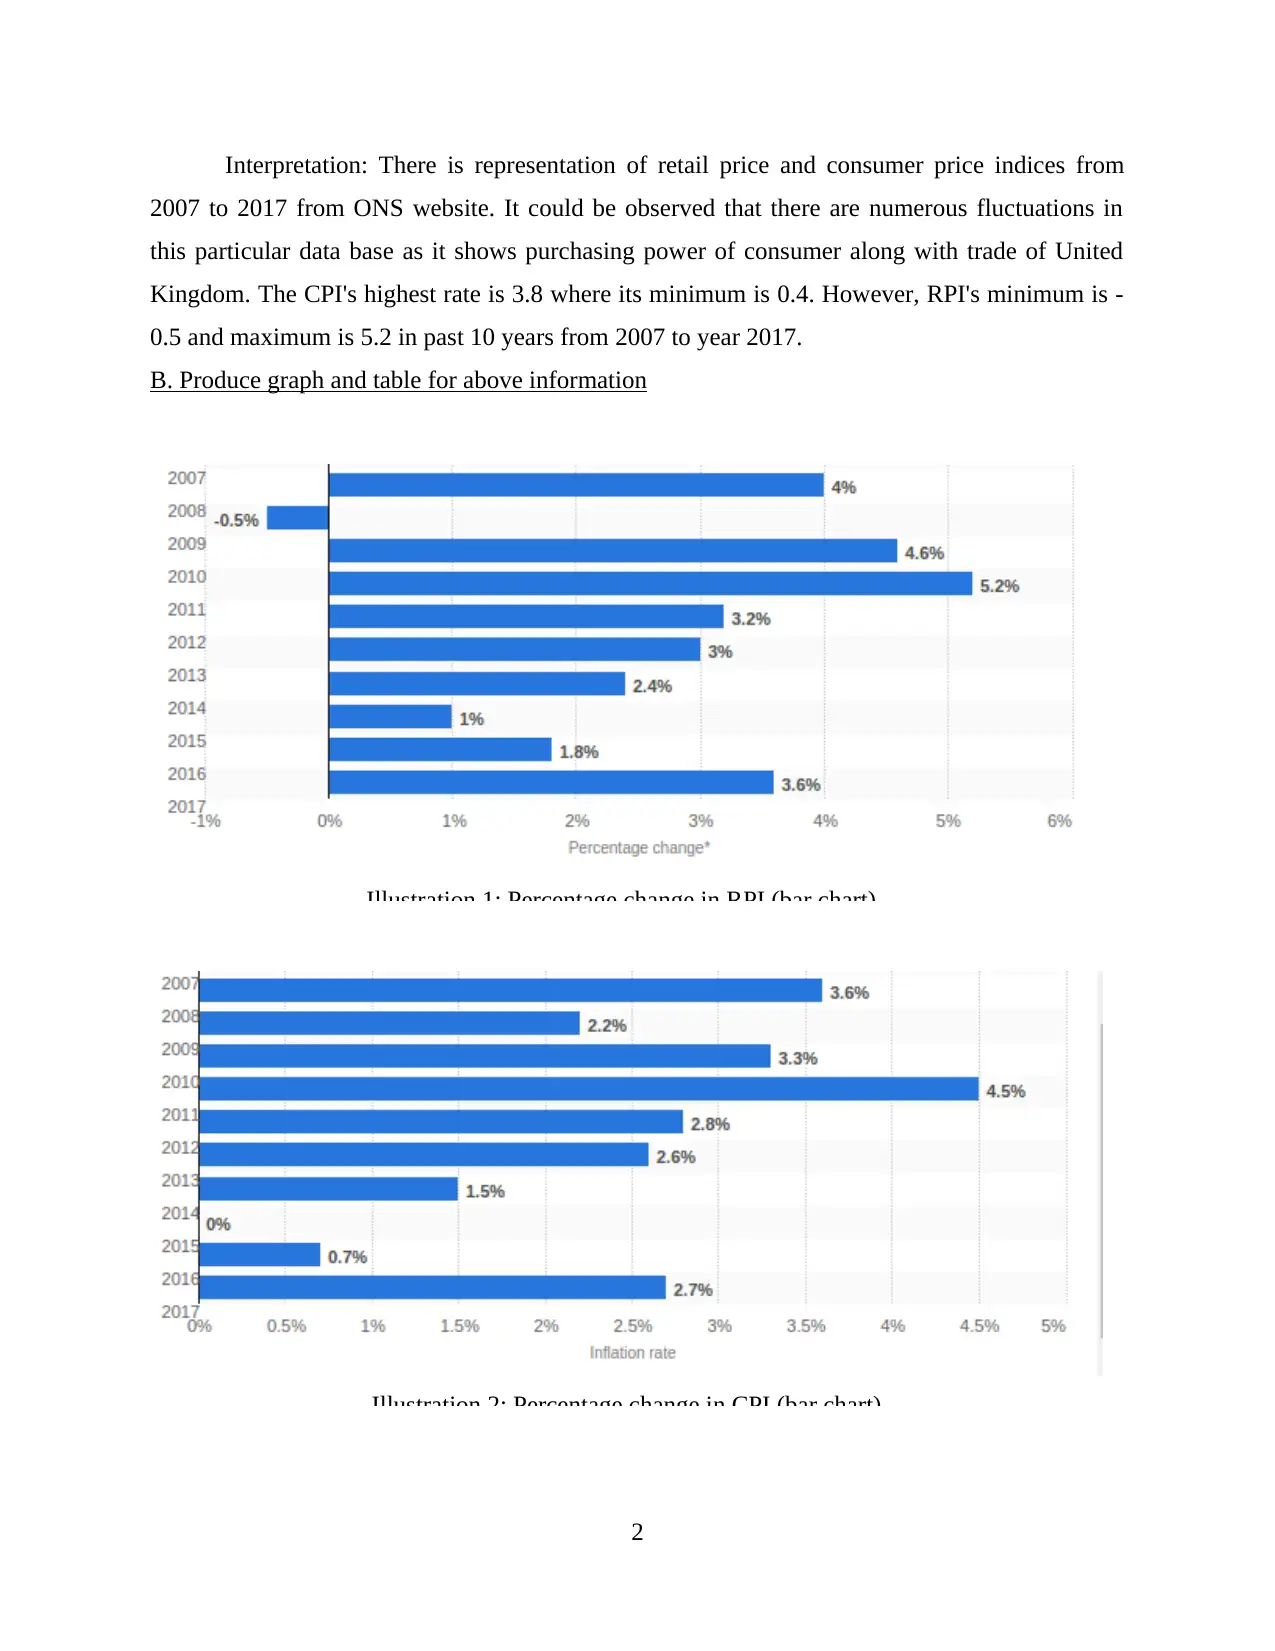
Interpretation: The above graphical format is of CPI and RPI of over past 10 years as
these statistics are representing percentage change in UK. On basis of RPI, the largest increment
was in year 2011 by 5.2% as it raised in each year of duration of 17 year with exception in year
2009 where it faced decrement by 0.5%. With context of CPI, it is most common measure of
inflation as in 2015 it was 0 percent as lowest for decade which is reflected in above chart.
Henceforth, it could be interpreted that UK's RPI has attained growth and capability for
collecting the best outcome.
C. Retail Price Index vs Consumer price Index
RPI and CPI are referred as very popular methods for purpose of measuring inflation.
These both indices would be using basket of goods for extracting inflation as it is very difficult
for differentiating its. Consumer Price Index is forecasted and average price of economic result is
purchased through consumer as specific base where Retail Price Index helps in measuring
differences in price of output of retail economic (Khalil, Noor-ul-Amin and Hanif, 2018). The
main difference among RPI and CPI is that mortgage interest payment is excluded in CPI
whereas retail price Index includes this.
The size of population is large in CPI as compared to RPI.
Geometric mean is used in CPI for extracting difference among previous and current
price. However, RPI will be using arithmetic mean where number of item are directly
divided through sum of all price.
3
The differences in price payment through consumers with context of market basket of
services and goods in basis of CPI. The consumer inflation measure which extracts
alteration in retail price as representative basket of numerous goods and services.
The value of RPI is higher than compared to CPI.
RPI would be considering cost of housing, mortgage interest payments, road fund license,
council tax and building insurance whereas CPI will exclude these costs.
CPI would be including university accommodation and foreign student tuition fees but
RPI will not include these costs.
These both indices would be reflecting alterations in price related to cost of goods and
services as main implication of difference is because of estimating or price alteration with
different target audience. It has been clearly viewed that CPI covers different items but not in
RPI.
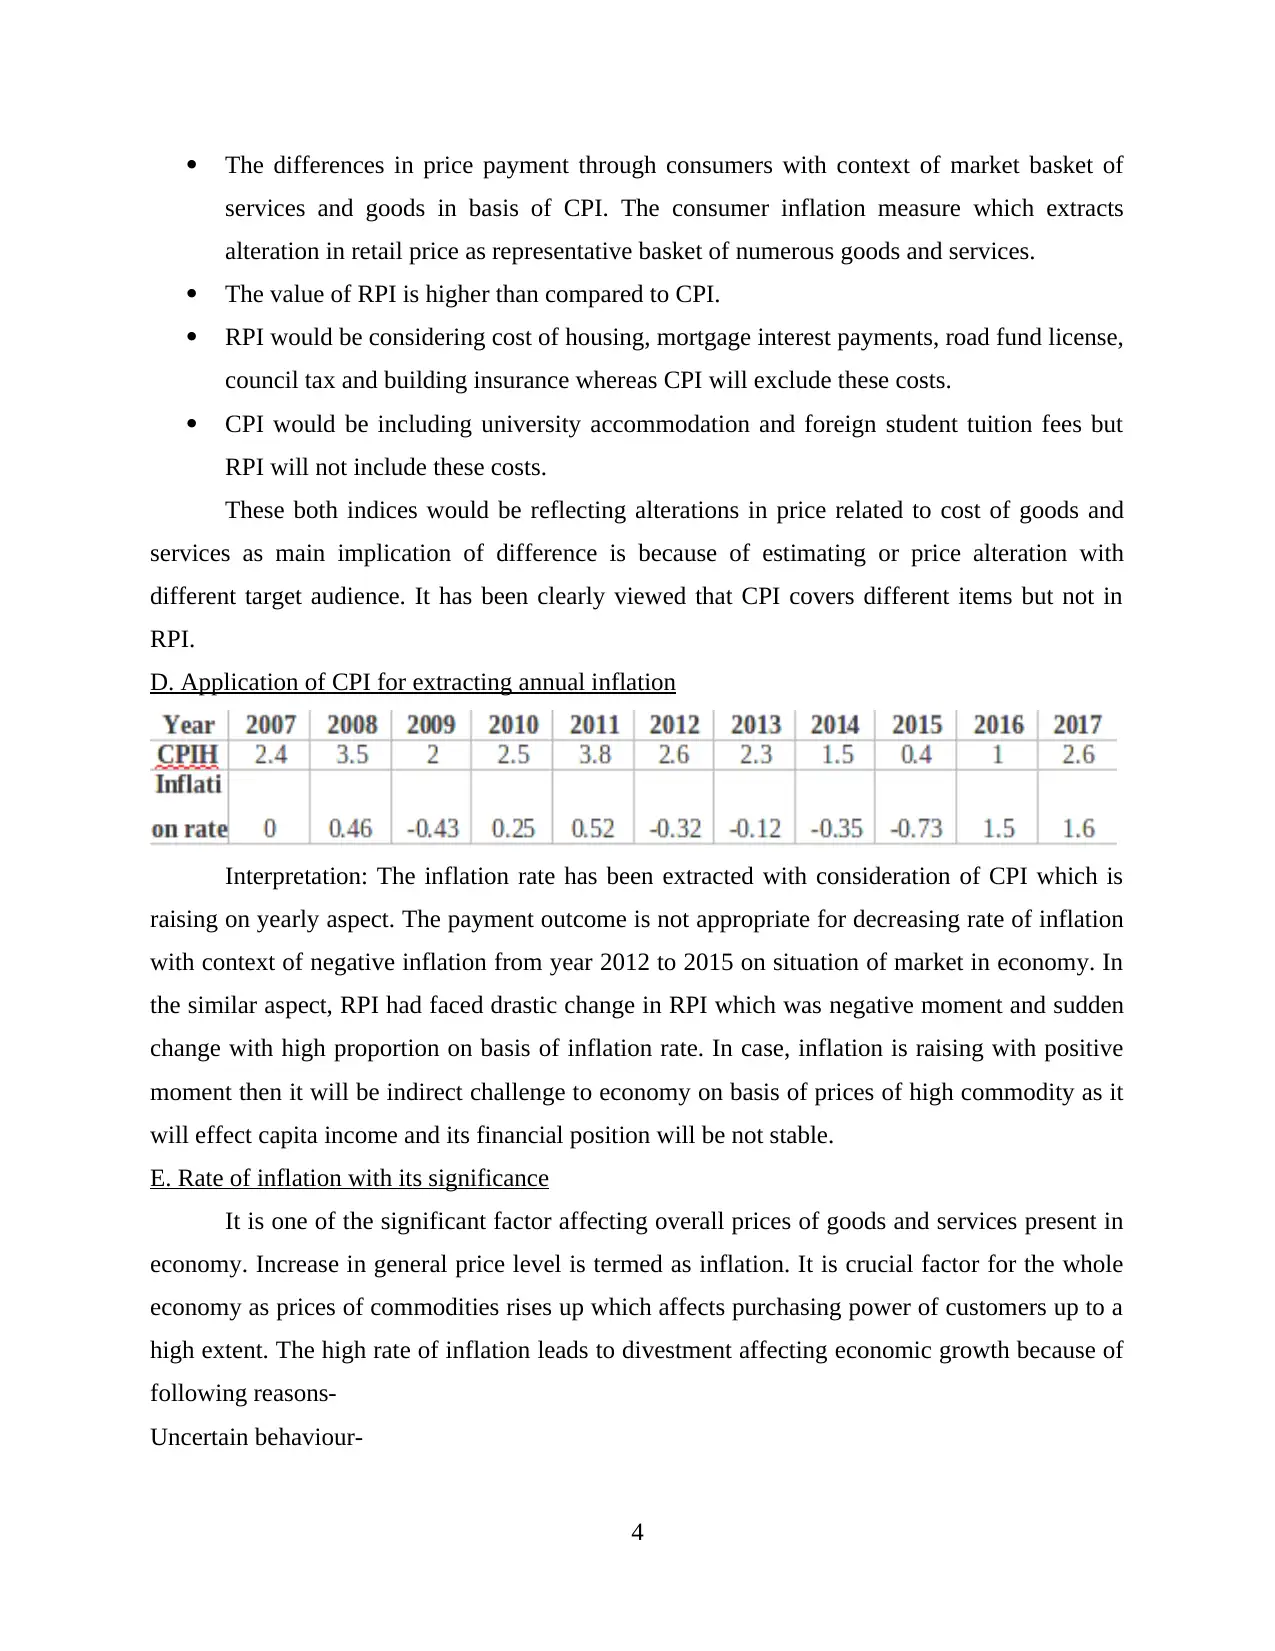
D. Application of CPI for extracting annual inflation
Interpretation: The inflation rate has been extracted with consideration of CPI which is
raising on yearly aspect. The payment outcome is not appropriate for decreasing rate of inflation
with context of negative inflation from year 2012 to 2015 on situation of market in economy. In
the similar aspect, RPI had faced drastic change in RPI which was negative moment and sudden
change with high proportion on basis of inflation rate. In case, inflation is raising with positive
moment then it will be indirect challenge to economy on basis of prices of high commodity as it
will effect capita income and its financial position will be not stable.
E. Rate of inflation with its significance
It is one of the significant factor affecting overall prices of goods and services present in
economy. Increase in general price level is termed as inflation. It is crucial factor for the whole
economy as prices of commodities rises up which affects purchasing power of customers up to a
high extent. The high rate of inflation leads to divestment affecting economic growth because of
following reasons-
Uncertain behaviour-
4
services and goods in basis of CPI. The consumer inflation measure which extracts
alteration in retail price as representative basket of numerous goods and services.
The value of RPI is higher than compared to CPI.
RPI would be considering cost of housing, mortgage interest payments, road fund license,
council tax and building insurance whereas CPI will exclude these costs.
CPI would be including university accommodation and foreign student tuition fees but
RPI will not include these costs.
These both indices would be reflecting alterations in price related to cost of goods and
services as main implication of difference is because of estimating or price alteration with
different target audience. It has been clearly viewed that CPI covers different items but not in
RPI.
D. Application of CPI for extracting annual inflation
Interpretation: The inflation rate has been extracted with consideration of CPI which is
raising on yearly aspect. The payment outcome is not appropriate for decreasing rate of inflation
with context of negative inflation from year 2012 to 2015 on situation of market in economy. In
the similar aspect, RPI had faced drastic change in RPI which was negative moment and sudden
change with high proportion on basis of inflation rate. In case, inflation is raising with positive
moment then it will be indirect challenge to economy on basis of prices of high commodity as it
will effect capita income and its financial position will be not stable.
E. Rate of inflation with its significance
It is one of the significant factor affecting overall prices of goods and services present in
economy. Increase in general price level is termed as inflation. It is crucial factor for the whole
economy as prices of commodities rises up which affects purchasing power of customers up to a
high extent. The high rate of inflation leads to divestment affecting economic growth because of
following reasons-
Uncertain behaviour-
4
⊘ This is a preview!⊘
Do you want full access?
Subscribe today to unlock all pages.
Trusted by 1+ million students worldwide
The increase in inflation and much volatility creates uncertainties with regards to future
price and cost and as a result, it leads to divestment and thus, decrement in commodities'
demand.
Unsustainable regarding inflation-
Increase in inflation will lead to inappropriate adjustments of deflationary fiscal policy by
banks and further interest rate will hike. High inflationary situation prevailing in countries will
pave the way for recession in economy (Importance of Inflation for Industry. 2016).
This means that inflation is significant as it creates ease in terms of debtors as it will be
able to attain efficiency in terms of repayment of loan amount in effective manner. Moreover,
borrowing and lending activities increases spending level. It can be analysed that inverse
relationship is found between inflation and unemployment.
ACTIVITY 2
A. Hourly Pay rates
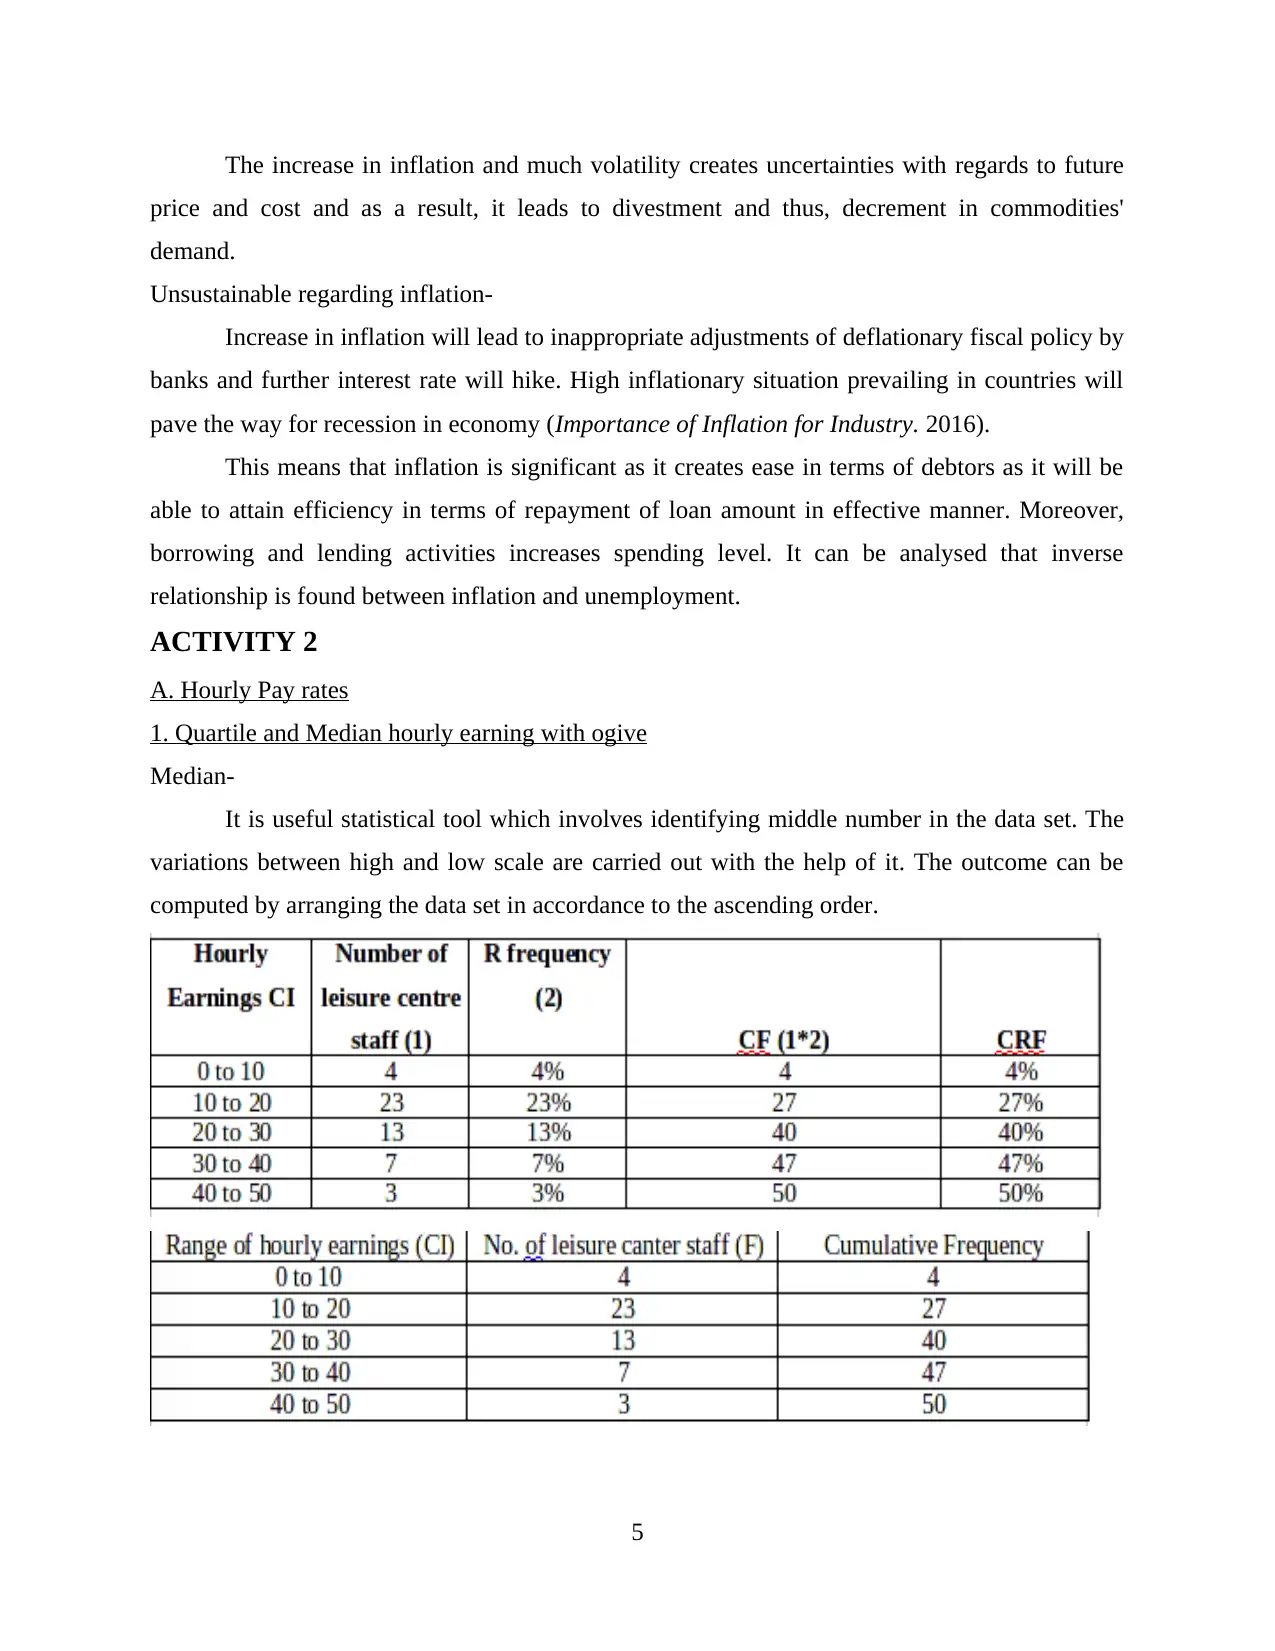
1. Quartile and Median hourly earning with ogive
Median-
It is useful statistical tool which involves identifying middle number in the data set. The
variations between high and low scale are carried out with the help of it. The outcome can be
computed by arranging the data set in accordance to the ascending order.
5
price and cost and as a result, it leads to divestment and thus, decrement in commodities'
demand.
Unsustainable regarding inflation-
Increase in inflation will lead to inappropriate adjustments of deflationary fiscal policy by
banks and further interest rate will hike. High inflationary situation prevailing in countries will
pave the way for recession in economy (Importance of Inflation for Industry. 2016).
This means that inflation is significant as it creates ease in terms of debtors as it will be
able to attain efficiency in terms of repayment of loan amount in effective manner. Moreover,
borrowing and lending activities increases spending level. It can be analysed that inverse
relationship is found between inflation and unemployment.
ACTIVITY 2
A. Hourly Pay rates
1. Quartile and Median hourly earning with ogive
Median-
It is useful statistical tool which involves identifying middle number in the data set. The
variations between high and low scale are carried out with the help of it. The outcome can be
computed by arranging the data set in accordance to the ascending order.
5
Paraphrase This Document
Need a fresh take? Get an instant paraphrase of this document with our AI Paraphraser
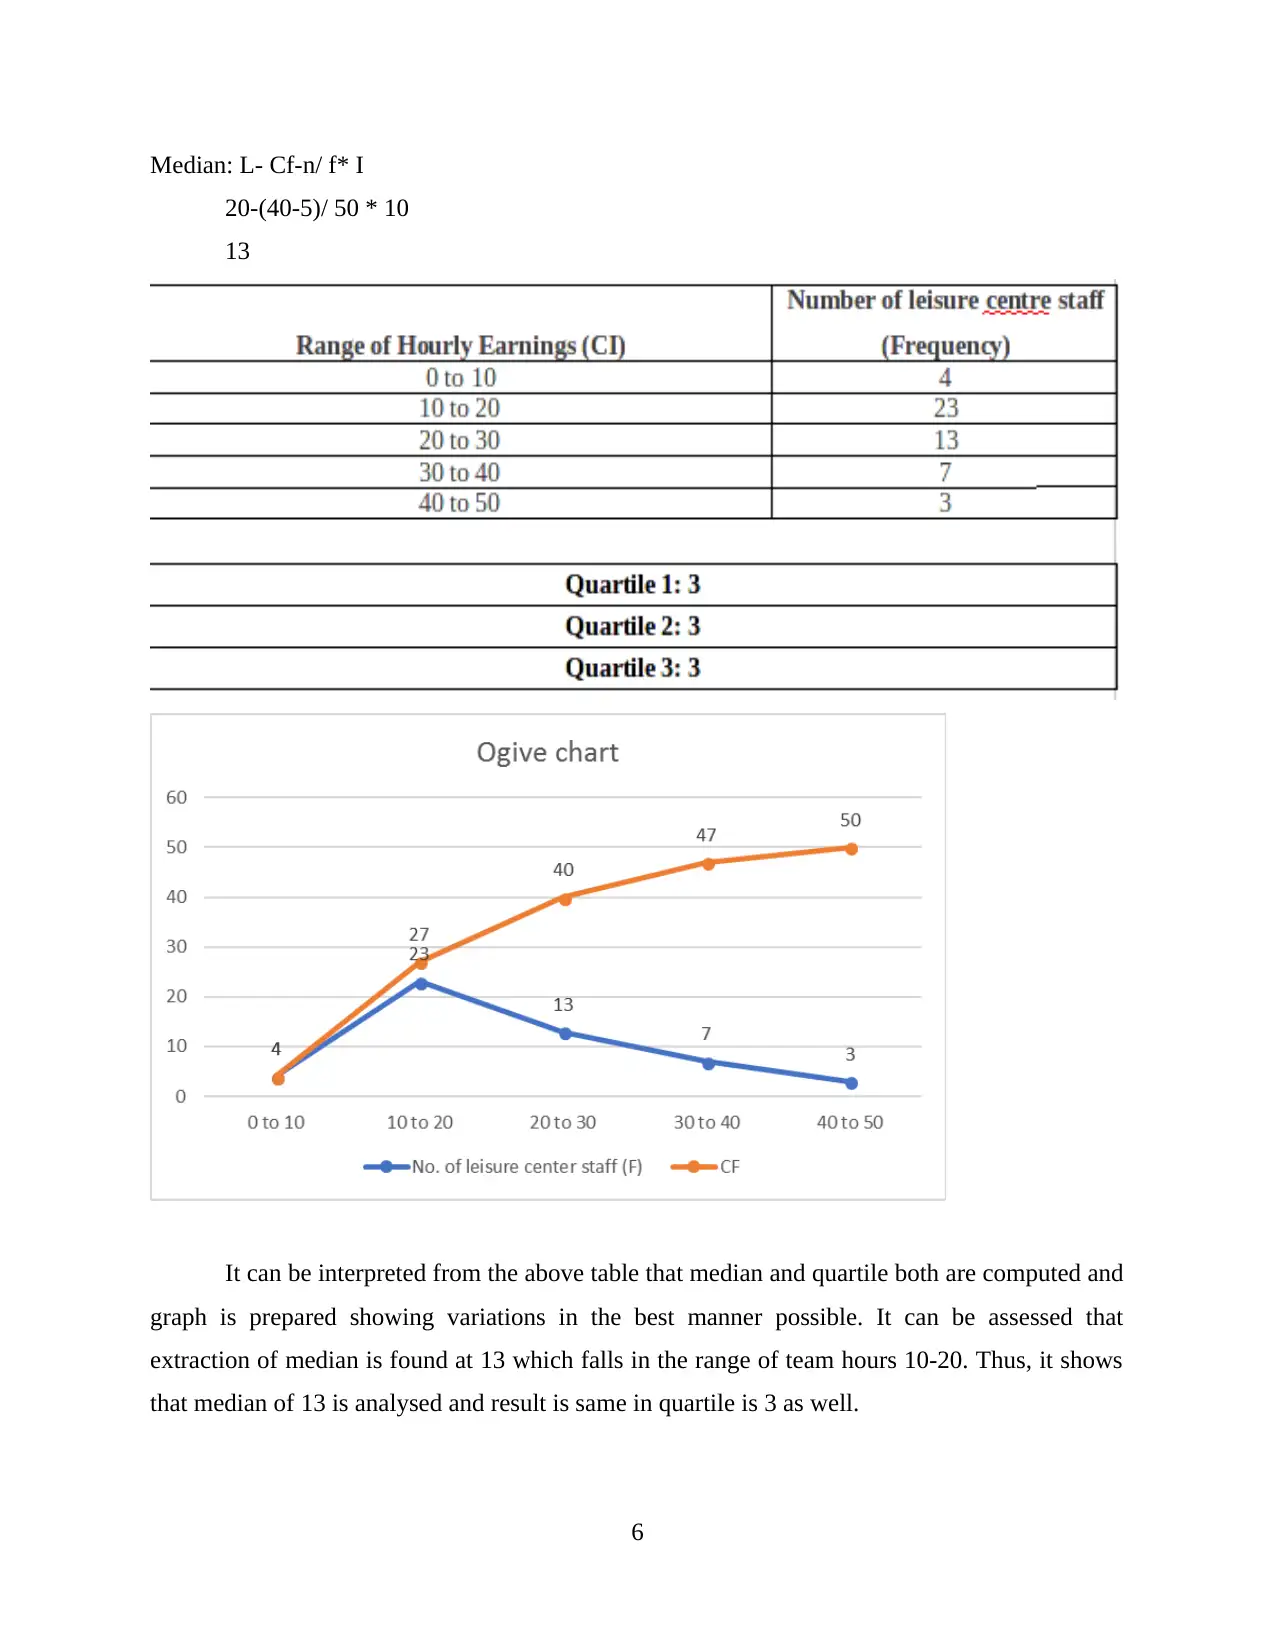
Median: L- Cf-n/ f* I
20-(40-5)/ 50 * 10
13
It can be interpreted from the above table that median and quartile both are computed and
graph is prepared showing variations in the best manner possible. It can be assessed that
extraction of median is found at 13 which falls in the range of team hours 10-20. Thus, it shows
that median of 13 is analysed and result is same in quartile is 3 as well.
6
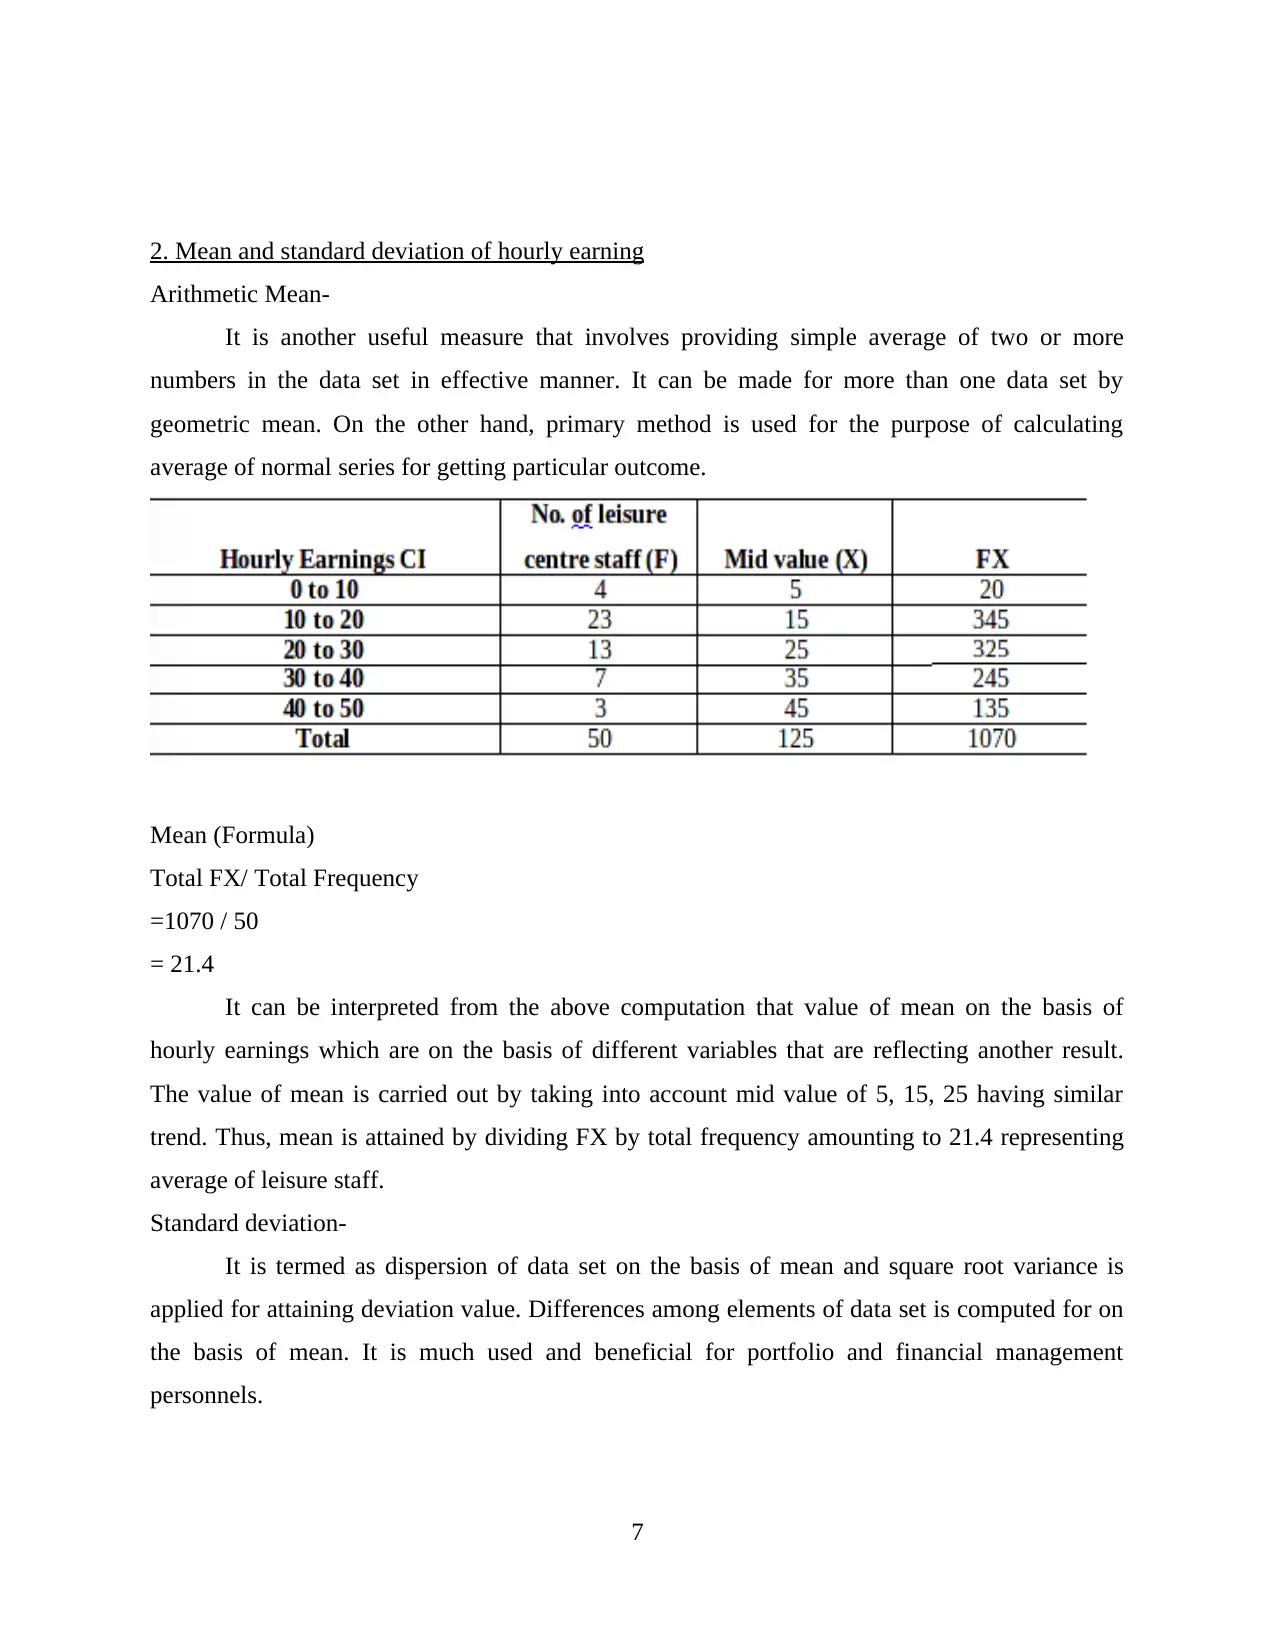
2. Mean and standard deviation of hourly earning
Arithmetic Mean-
It is another useful measure that involves providing simple average of two or more
numbers in the data set in effective manner. It can be made for more than one data set by
geometric mean. On the other hand, primary method is used for the purpose of calculating
average of normal series for getting particular outcome.
Mean (Formula)
Total FX/ Total Frequency
=1070 / 50
= 21.4
It can be interpreted from the above computation that value of mean on the basis of
hourly earnings which are on the basis of different variables that are reflecting another result.
The value of mean is carried out by taking into account mid value of 5, 15, 25 having similar
trend. Thus, mean is attained by dividing FX by total frequency amounting to 21.4 representing
average of leisure staff.
Standard deviation-
It is termed as dispersion of data set on the basis of mean and square root variance is
applied for attaining deviation value. Differences among elements of data set is computed for on
the basis of mean. It is much used and beneficial for portfolio and financial management
personnels.
7
⊘ This is a preview!⊘
Do you want full access?
Subscribe today to unlock all pages.
Trusted by 1+ million students worldwide
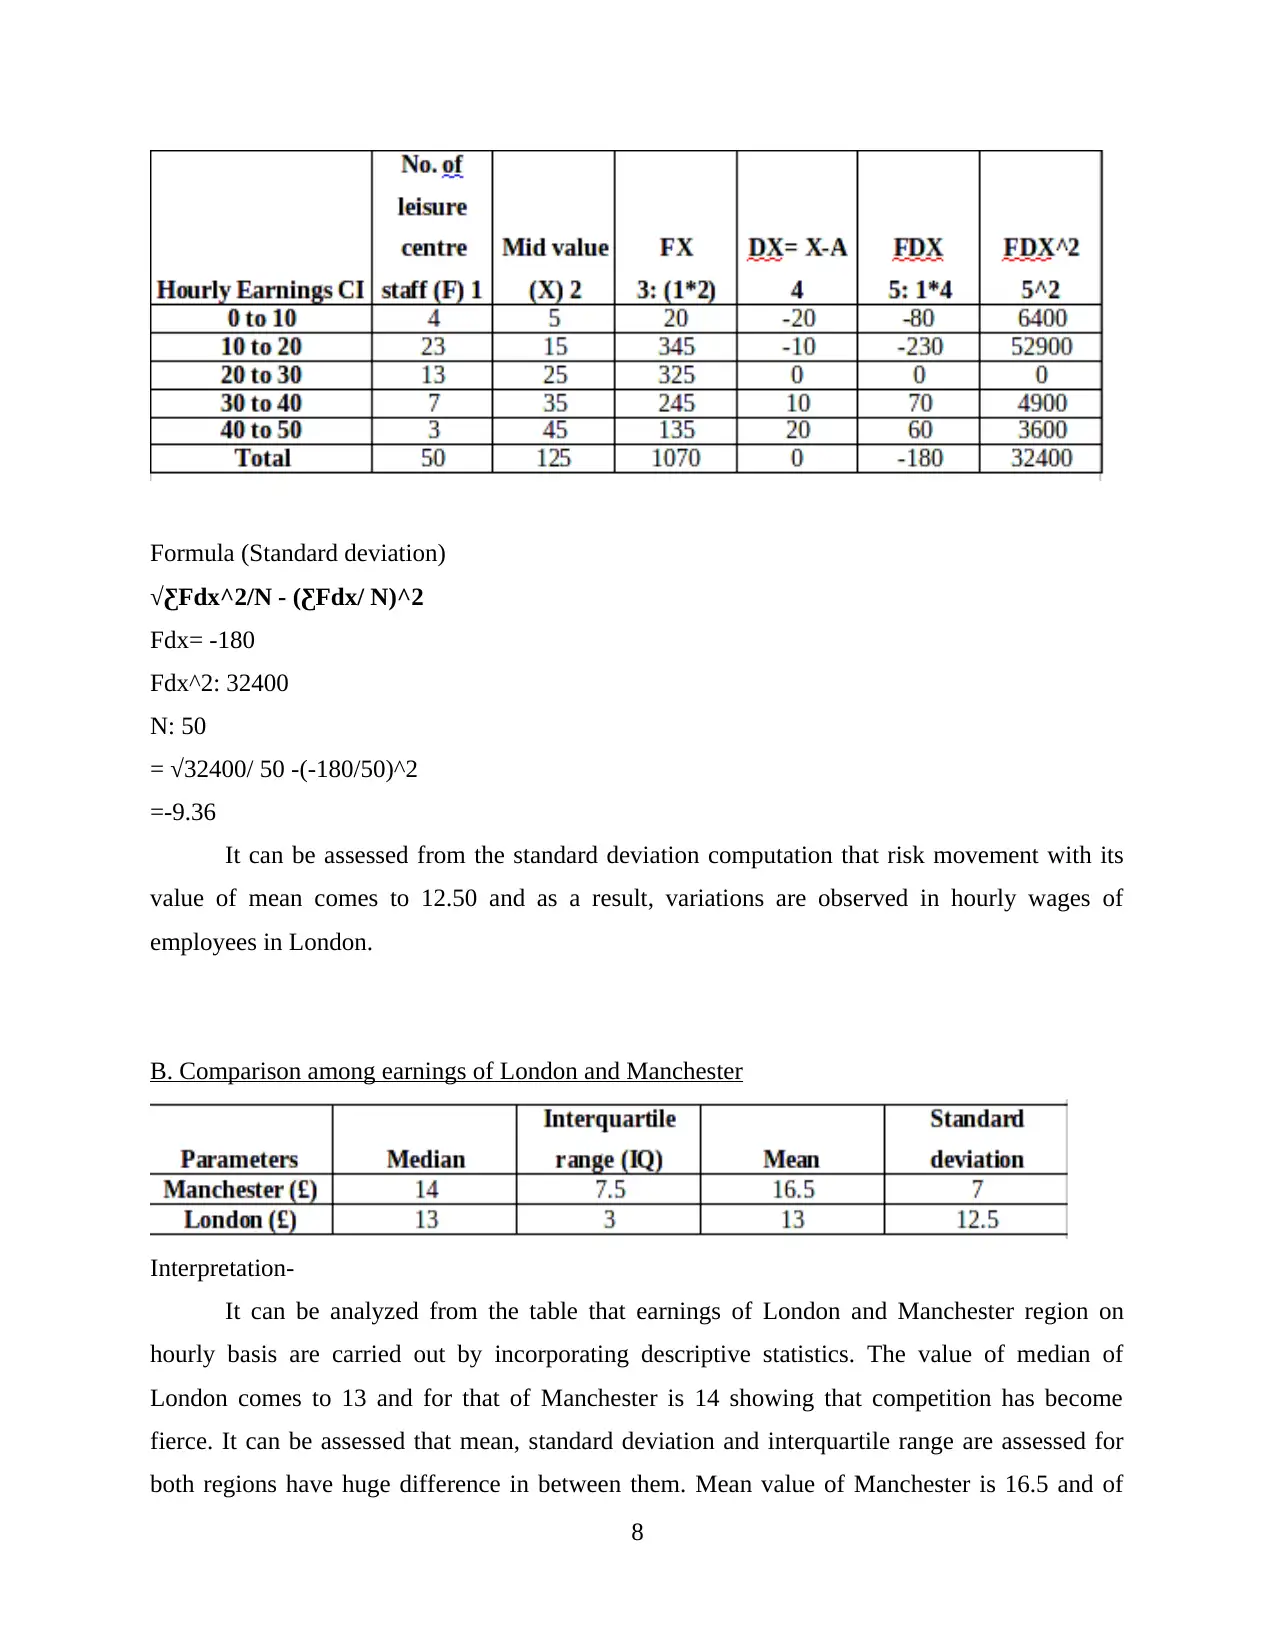
Formula (Standard deviation)
√ƸFdx^2/N - (ƸFdx/ N)^2
Fdx= -180
Fdx^2: 32400
N: 50
= √32400/ 50 -(-180/50)^2
=-9.36
It can be assessed from the standard deviation computation that risk movement with its
value of mean comes to 12.50 and as a result, variations are observed in hourly wages of
employees in London.
B. Comparison among earnings of London and Manchester
Interpretation-
It can be analyzed from the table that earnings of London and Manchester region on
hourly basis are carried out by incorporating descriptive statistics. The value of median of
London comes to 13 and for that of Manchester is 14 showing that competition has become
fierce. It can be assessed that mean, standard deviation and interquartile range are assessed for
both regions have huge difference in between them. Mean value of Manchester is 16.5 and of
8
Paraphrase This Document
Need a fresh take? Get an instant paraphrase of this document with our AI Paraphraser
London comes to 13. On the other hand, interquartile range for Manchester comes to 7.5, while,
of Manchester is 3
ACTIVITY 3
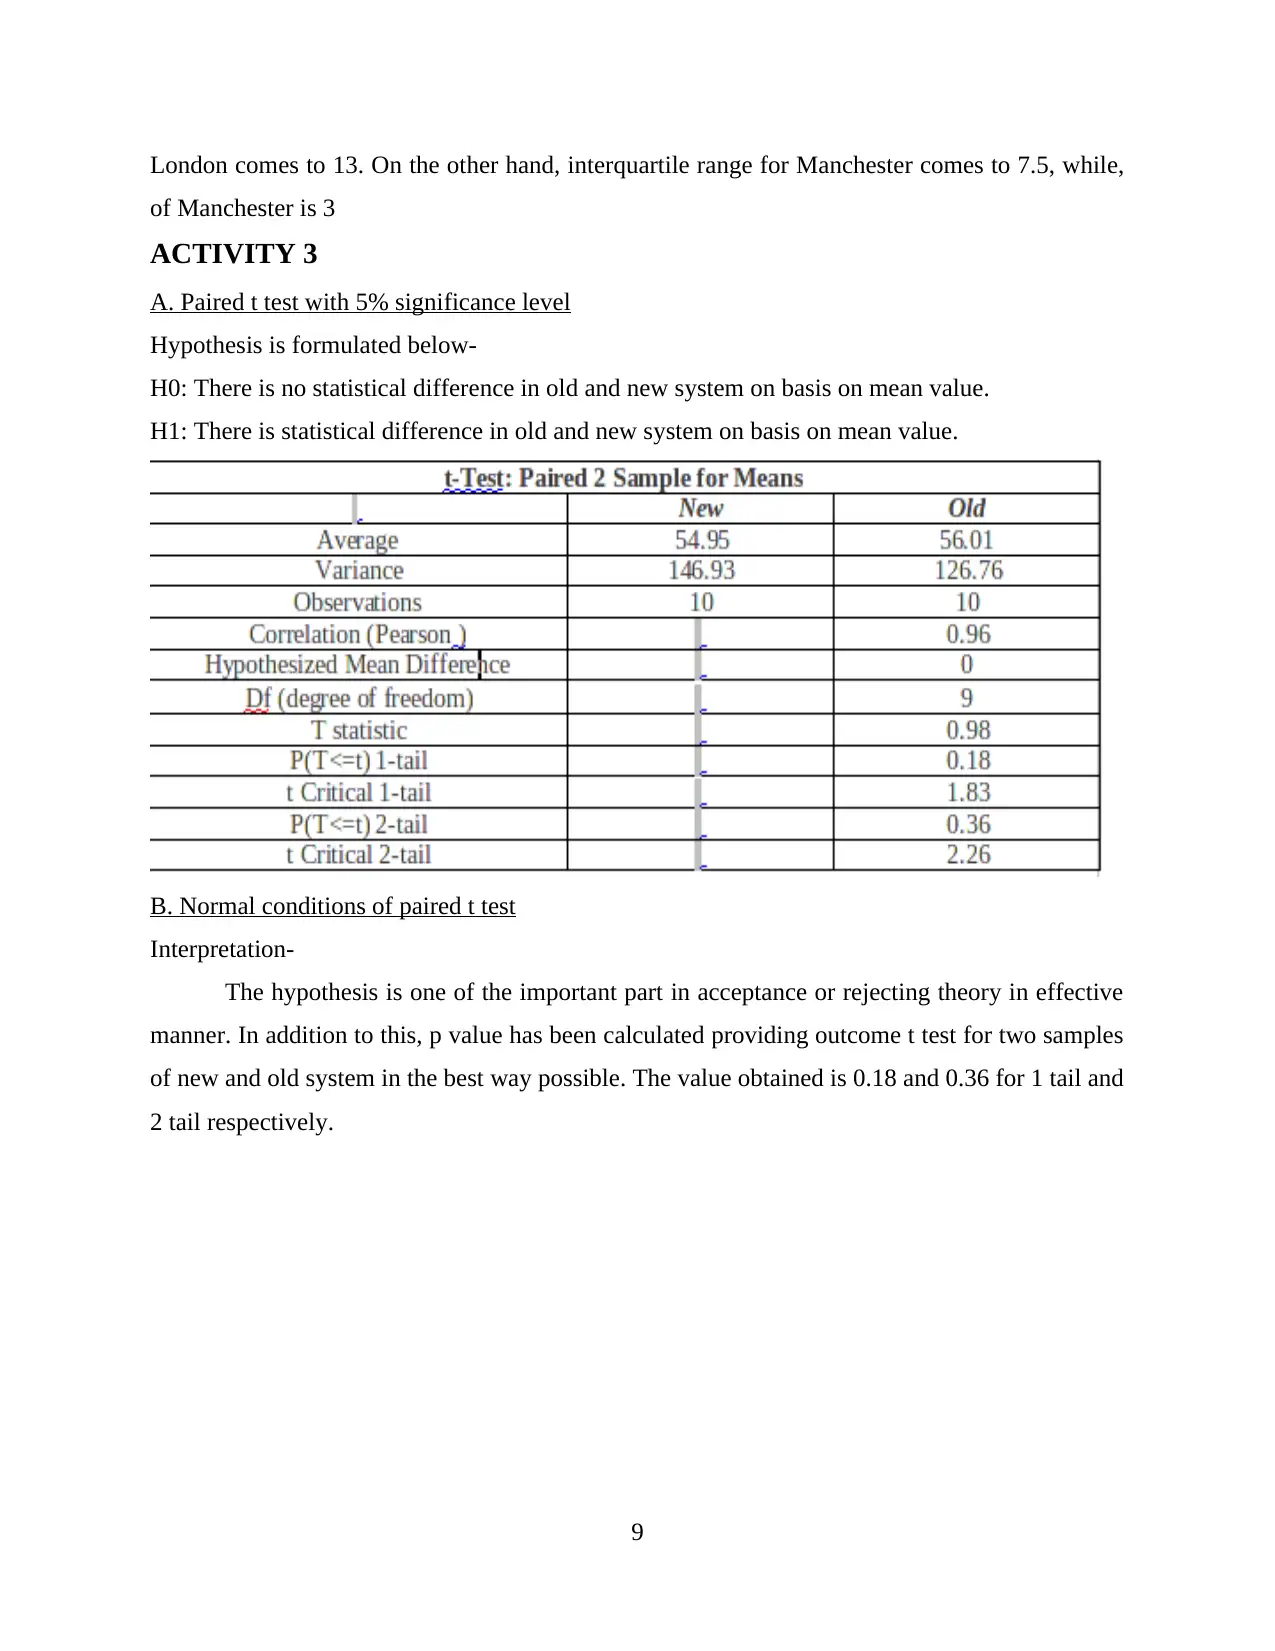
A. Paired t test with 5% significance level
Hypothesis is formulated below-
H0: There is no statistical difference in old and new system on basis on mean value.
H1: There is statistical difference in old and new system on basis on mean value.
B. Normal conditions of paired t test
Interpretation-
The hypothesis is one of the important part in acceptance or rejecting theory in effective
manner. In addition to this, p value has been calculated providing outcome t test for two samples
of new and old system in the best way possible. The value obtained is 0.18 and 0.36 for 1 tail and
2 tail respectively.
9
of Manchester is 3
ACTIVITY 3
A. Paired t test with 5% significance level
Hypothesis is formulated below-
H0: There is no statistical difference in old and new system on basis on mean value.
H1: There is statistical difference in old and new system on basis on mean value.
B. Normal conditions of paired t test
Interpretation-
The hypothesis is one of the important part in acceptance or rejecting theory in effective
manner. In addition to this, p value has been calculated providing outcome t test for two samples
of new and old system in the best way possible. The value obtained is 0.18 and 0.36 for 1 tail and
2 tail respectively.
9
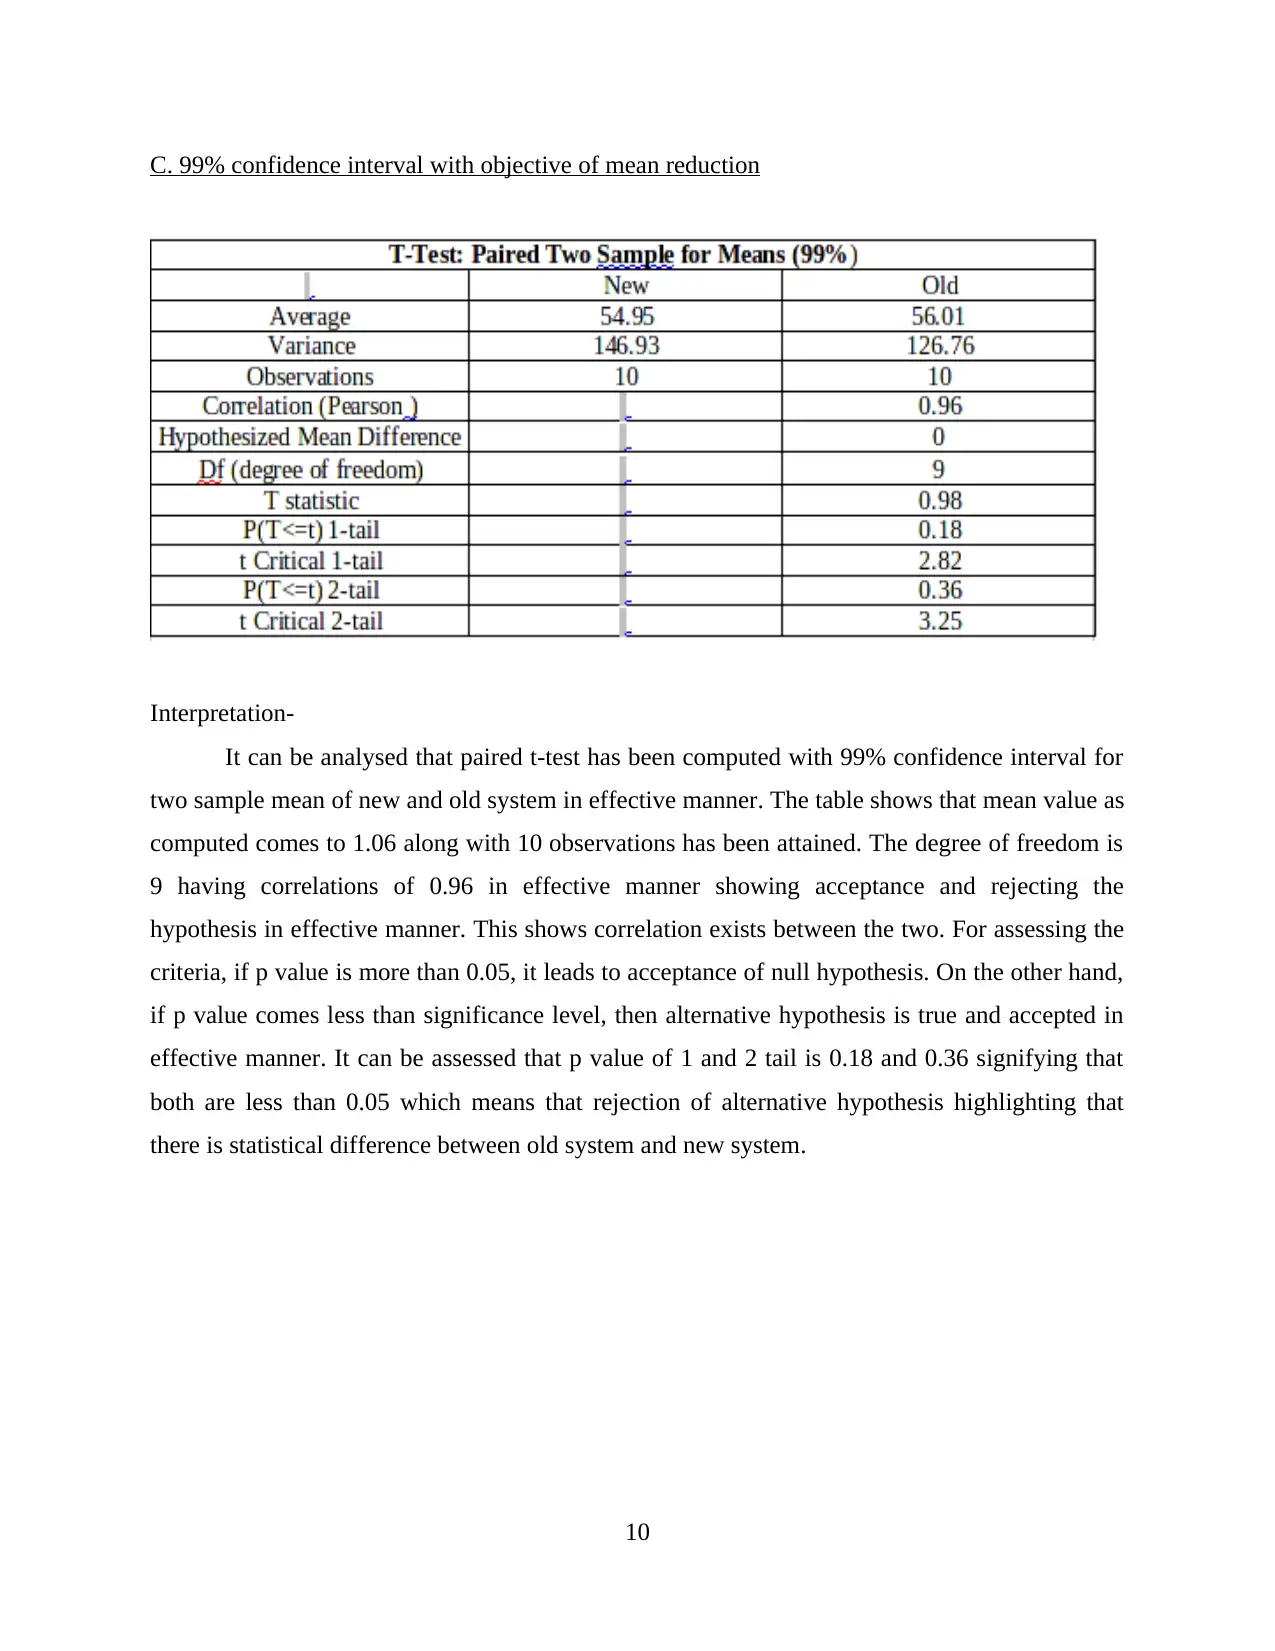
C. 99% confidence interval with objective of mean reduction
Interpretation-
It can be analysed that paired t-test has been computed with 99% confidence interval for
two sample mean of new and old system in effective manner. The table shows that mean value as
computed comes to 1.06 along with 10 observations has been attained. The degree of freedom is
9 having correlations of 0.96 in effective manner showing acceptance and rejecting the
hypothesis in effective manner. This shows correlation exists between the two. For assessing the
criteria, if p value is more than 0.05, it leads to acceptance of null hypothesis. On the other hand,
if p value comes less than significance level, then alternative hypothesis is true and accepted in
effective manner. It can be assessed that p value of 1 and 2 tail is 0.18 and 0.36 signifying that
both are less than 0.05 which means that rejection of alternative hypothesis highlighting that
there is statistical difference between old system and new system.
10
⊘ This is a preview!⊘
Do you want full access?
Subscribe today to unlock all pages.
Trusted by 1+ million students worldwide
1 out of 16
Related Documents


Your All-in-One AI-Powered Toolkit for Academic Success.
+13062052269
info@desklib.com
Available 24*7 on WhatsApp / Email
![[object Object]](/_next/static/media/star-bottom.7253800d.svg)
Unlock your academic potential
Copyright © 2020–2026 A2Z Services. All Rights Reserved. Developed and managed by ZUCOL.